
The importance of trading indicators.
There is no doubt about the importance of trading indicators for those who seek to technically analyze the financial markets. This applies to FX, Commodities, Indices, Stocks, ETFs, and any asset class that includes financial instruments with smooth enough data to be able to study it.
Trading indicators are an important addition to a trader’s arsenal of tools. Aside from a basic understanding of charts as well as price patterns, technical indicators can indeed help further confirm whether the market is trending or consolidating as well as identify potential momentum or overbought/oversold conditions.
There are two types of indicators: Leading and Lagging Indicators. As evident by their names, leading indicators are more helpful at determining what could possibly take place over a certain period while lagging is visualizing an already established market condition. The latter could be useful if a trader is not entirely sure what the current market condition is or it's somehow unclear to the naked eye.
The best indicators to use
The simple moving average (Figure 1) helps the trader identify the current market direction while discounting short-term noise or spikes. It’s simply the average of price over a specified period of time, based on the trader’s settings.
The bigger the period used for moving averages, the smoother the line will be as it analyzes more data and over a longer period of time.
Exponential Moving Average
An exponential moving average is very similar to the simple moving average as it calculates the average of price data over a specific period. The main difference lies in the Exponential version placing more emphasis and weight on recent data. This can be useful if the instrument under analysis is exhibiting moves that are not very smooth..

Figure 1 – 4-hour USDCHF Moving Average chart
Please click For bigger size
Stochastic Oscillator
The stochastic oscillator (Figure 2) is comprised of two lines and is considered a momentum and a trend indicator at the same time. It compares the price of a financial product to a range of previous prices as defined in the settings of the indicator. Stochastic oscillator fluctuates between 0 and 100 and is usually used as an oversold/overbought type of indicator yet it can be used in other ways.
For example, a stochastic above 50 is seen as positive while a reading below 50 is seen as negative. When looking at it from an oversold and overbought perspective, a reading above 80 is seen as overbought and ripe for a correction lower while a reading below 20 is seen as oversold with a potential reversal setting up.
One thing to keep in mind is that a steady reading above 80 or below 20 indicates a strong trend is in place and a correction may not necessarily take place despite the extreme readings. Some traders may look for moves above 80 or below 20 to enter trades.

Figure 2 – 4-hour USDCHF stochastics chart
Please click For bigger size
Bollinger Bands
An indicator that is made up of a moving average with two bands (Figure 3) around it. It shows the typical range of a financial product. The band may expand when volatility increases and will tighten when the price action is relatively calm with small ranges.
When price moves outside the band, not only does it signify above-average volatility, but also the beginning of a new trend or a mean reversion setup where the market will correct towards the moving average.
During periods of low volatility, the bands will tighten and, if this tight range extends for a while, a move is likely to take place.
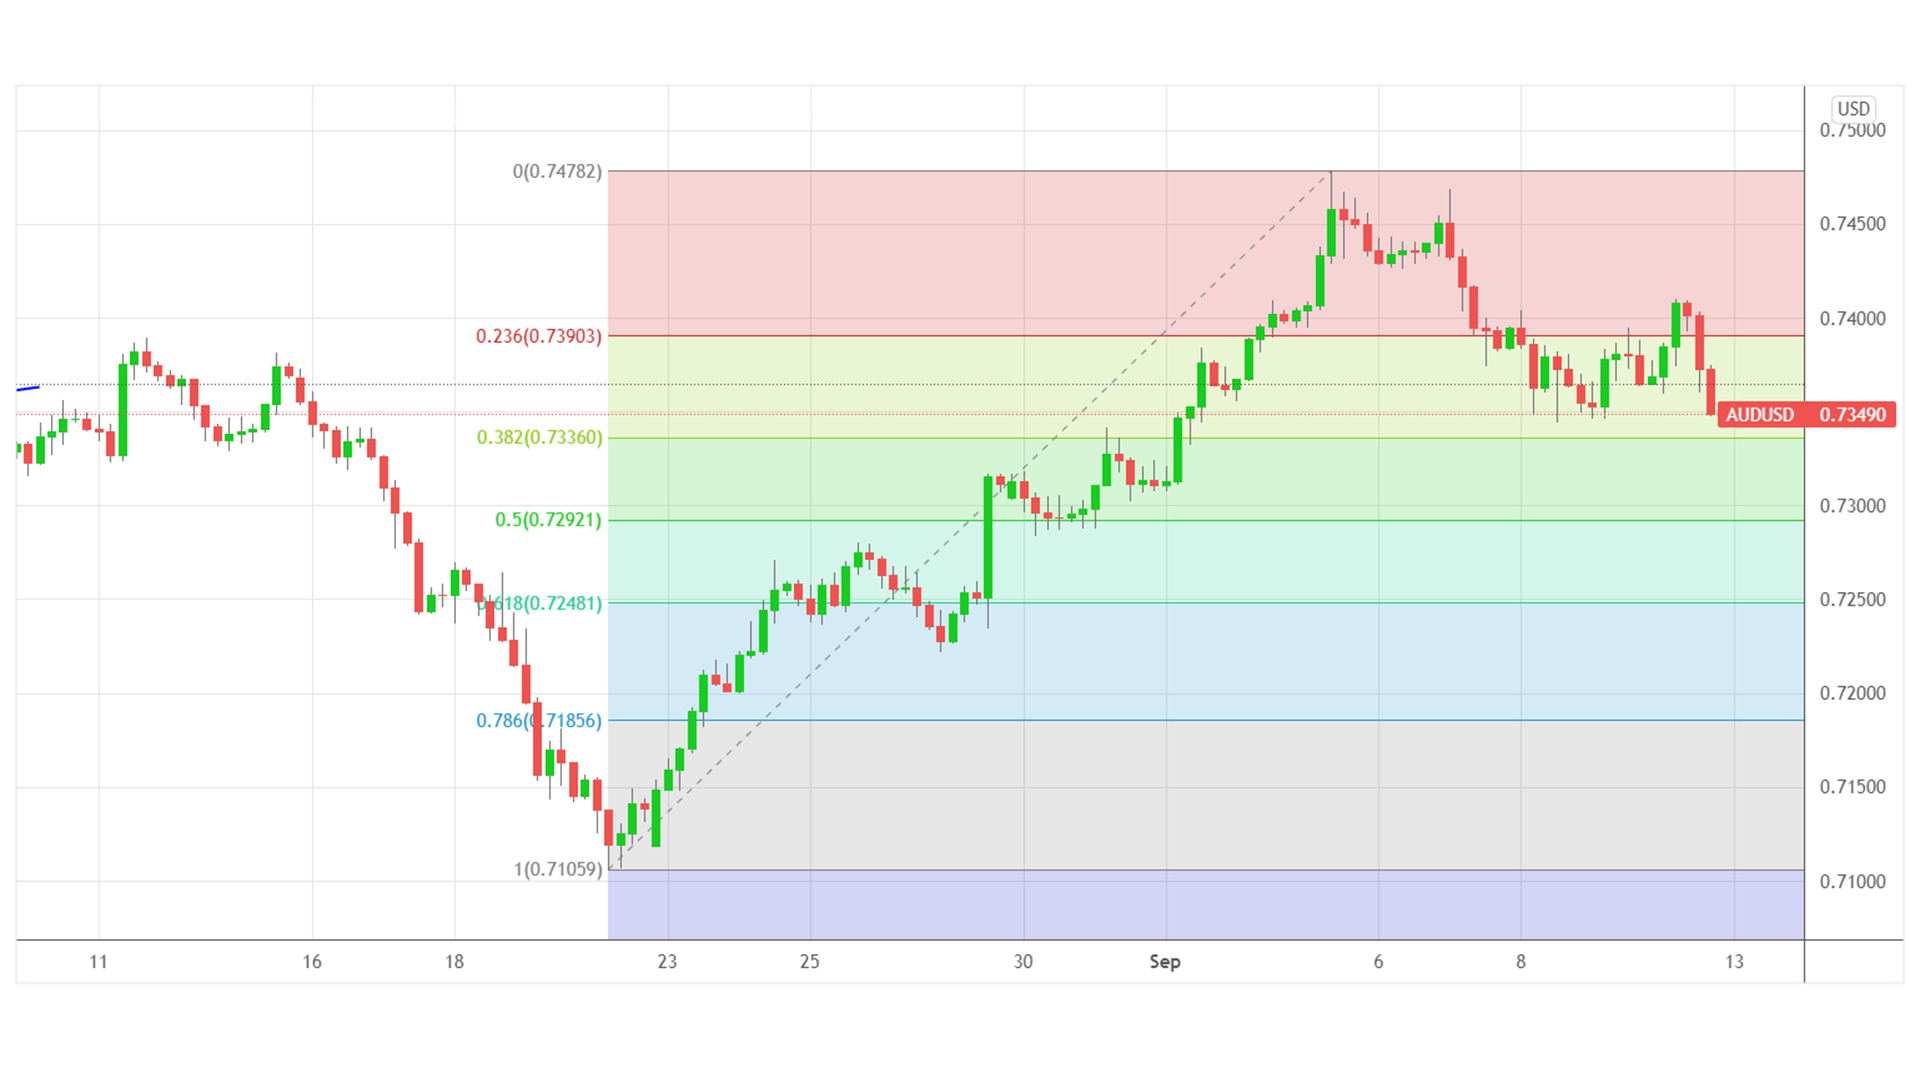
Figure 3 – 1-hour USDCHF Bollinger Bands chart
Please click For bigger size
Relative Strength Index
The relative strength index (Figure 4), also known as RSI is a highly popular indicator that has proven its worth across different markets and for many years. The RSI fluctuates between 0 and 100 and readings above 70 are seen as overbought while readings below 30 are considered oversold.
The RSI does well in highlighting reversals at the previously mentioned levels yet there are other ways to look at it. Readings that find support around 40 and extend beyond the 60 level highlights a potentially established uptrend. On the other hand, readings that find resistance around the 60 level and regularly dip below the 40 level could indicate an established downtrend.
The RSI is a sensitive indicator and its levels can be used to highlight support and resistance while being mindful of the 50 level which is seen as a crossroad between positive and negative momentum.

Figure 4 – 1-hour AUDUSD RSI chart
Please click For bigger size
Fibonacci Retracement
Fibonacci retracement (Figure 5) relies on mathematical ratios and is not exactly an indicator but a way to measure potential moves in the markets. They are very often associated with corrections within trends where traders will draw Fibonacci levels between a low and a high to estimate where the market may find support and resistance after a correction begins.
Popular Fibonacci levels include 38.2%, 50%, and the 61.8%, all act as magnets and often see price pausing and even reversing at those levels. Typically, a move beyond each level is likely to push the price to the next one whereas, a move beyond 61.8% is likely to indicate a reversal in place as the market has recovered close to two-thirds of the initial move before the correction began.

Figure 5 – 4-hour AUDUSD Fibonacci chart/b>
Please click For bigger size
Standard Deviation
The standard deviation indicator (Figure 6) is not a very popular one but it helps traders identify potentially volatile conditions. A period of low volatility and smaller price moves may be a precursor to volatile conditions and big moves. The opposite is true as the market becomes volatile and as action subsides, the period that ensues will likely see smaller and tighter price ranges.
Average Directional Index
The average directional index, also known as ADX is an indicator used to gauge the strength of a current trend. It fluctuates between 0 and 100 with readings above 25 seen as strong in terms of trend momentum. The indicator focuses on the move itself and disregards the direction. ADX is based on a price range of 14 which is the default period of the indicator but different settings can help highlight longer or shorter-term trends.

Figure 6 – 5-min AUDUSD standard deviation chart
Please click For bigger size
Putting it all together
Keeping the golden rules in mind is important before diving into a selection or combo of indicators. Beginning with the timeframe, select what suits you as a person and based on your risk tolerance. From there, begin by analyzing the obvious trend by just assessing recent price action. After that step, decide if you are looking for a continuation or a reversal trade. Once that’s out of the way, begin looking for price patterns such as double tops or head and shoulders and then use indicators to help you pinpoint your entries and better confirm the current trend or the potential reversal of the correction or the entire trend.
Indicators on their own might be useful especially on longer timeframes but they are prone to giving false signals if not used in conjunction with what the price has been doing and is currently doing. In other words, if the market is trending higher but your indicators are showing you a sell signal, it might manifest itself as a temporary correction that might be too small to be taken advantage of. On the off chance, you manage to enter into a reversal, such patterns don’t always present themselves. It’s best to trade continuations within an established trend or look for proper trend reversal patterns and confirm them further with indicators. When everything lines up, this is the time you should be looking to enter into a trade.