
Introduction
Technical Indicators is a mathematical formula calculated from price data to provide traders with some information that cannot be easily shown from pure prices like momentum and volatility. Indicators have two major classifications trend-following Moving averages and Bollinger Band and Oscillators like Commodity Channel Index (CCI) and Stochastics.
Commodity Channel Index (CCI)
The Commodity Channel Index was first described by Donald lambert in the October 1980 Issue of commodities magazine. Lambert originally developed CCI to identify cyclical turns in commodities, but the indicator can be successfully applied to indices, ETFs, stocks, and other securities. The CCI formula creates a conveniently used number that statistically expresses how far recent prices have departed from a moving average. In this manner, CCI can be used to identify overbought and oversold levels.
Commodity Channel Index calculation
The CCI formula calculates a simple moving of average daily prices and then calculates the mean deviation. The mean deviation is the sum of the differences between each period’s average price and its simple moving average. The mean deviation is then multiplied by a constant 0.015 and divided into the difference between the simple moving average and today’s average price. The trader can vary the number of periods used to calculate the simple shortening of the time span makes the index faster and more responsive to small market movements while lengthening the time span slows down the index and smooths out the market volatility
1- Typical Price= (H+L+C)/3
2- 20 SMA of the Typical Price
3- Calculate the Mean Deviation of price from the 20 SMA MD= abs (TP1-20SMA) +(TP2-20SMA) + --------+ (TP20 – 20SMA)/20
4- CCI = (Today Typical Price – Today Moving average)/MD* 0.015
The CCI is displayed as an oscillator that ranges above or below the zero line as shown in figure 1. Since the index measures how far prices have diverged from a moving average. CCI allows us to measure the strength of the trend. The theory is that the higher the CCI value the stronger the trend.

Figure 1
Please click For bigger size

Figure 2
Please click For bigger size
Trading with CCI
You cannot use the CCI signal alone without taking trend analysis into consideration because every market phase has a different trading characteristic. In an uptrend using CCI to time, the buy signal will always be the best CCI trading strategy, and in a downtrend using CCI to time the short signal.
How to trade using The CCI indicator in an uptrend?
During uptrend buyers always have control over price movement and the best trades are always around the end of the downward retracement where the best risk-reward is always so CCI can be used to time the entries.
In a strong uptrend, the CCI indicator will oscillate between the 100 level and zero level as shown in figure 3.
1- Buy signal is generated when breaking out level 100 and closing the position when the CCI moves below level 100 or the zero line. As shown in Figure 4.
2- Buy signal is generated when CCI breaks out the zero-line level but when it does not reach -100. Figure 5

Figure 3
Please click For bigger size

Figure 4
Please click For bigger size

Figure 5
Please click For bigger size
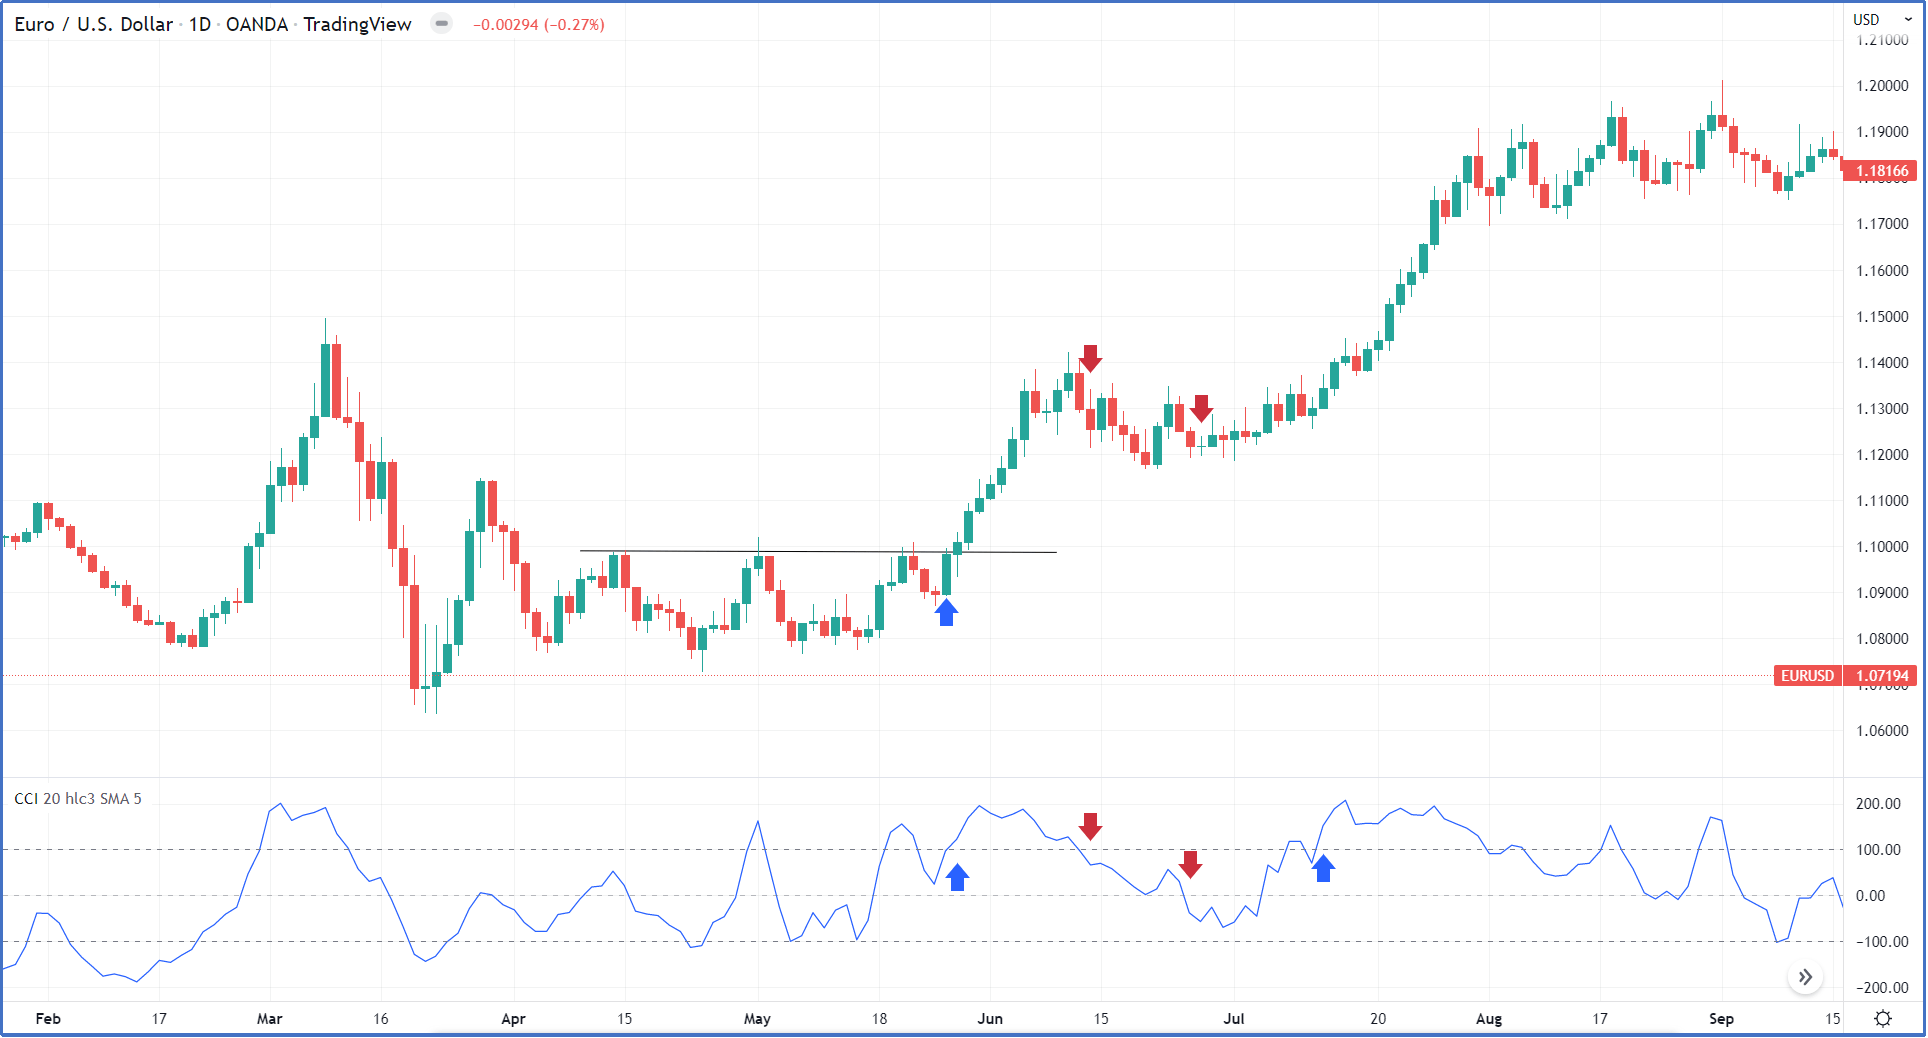
Figure 6
Please click For bigger size
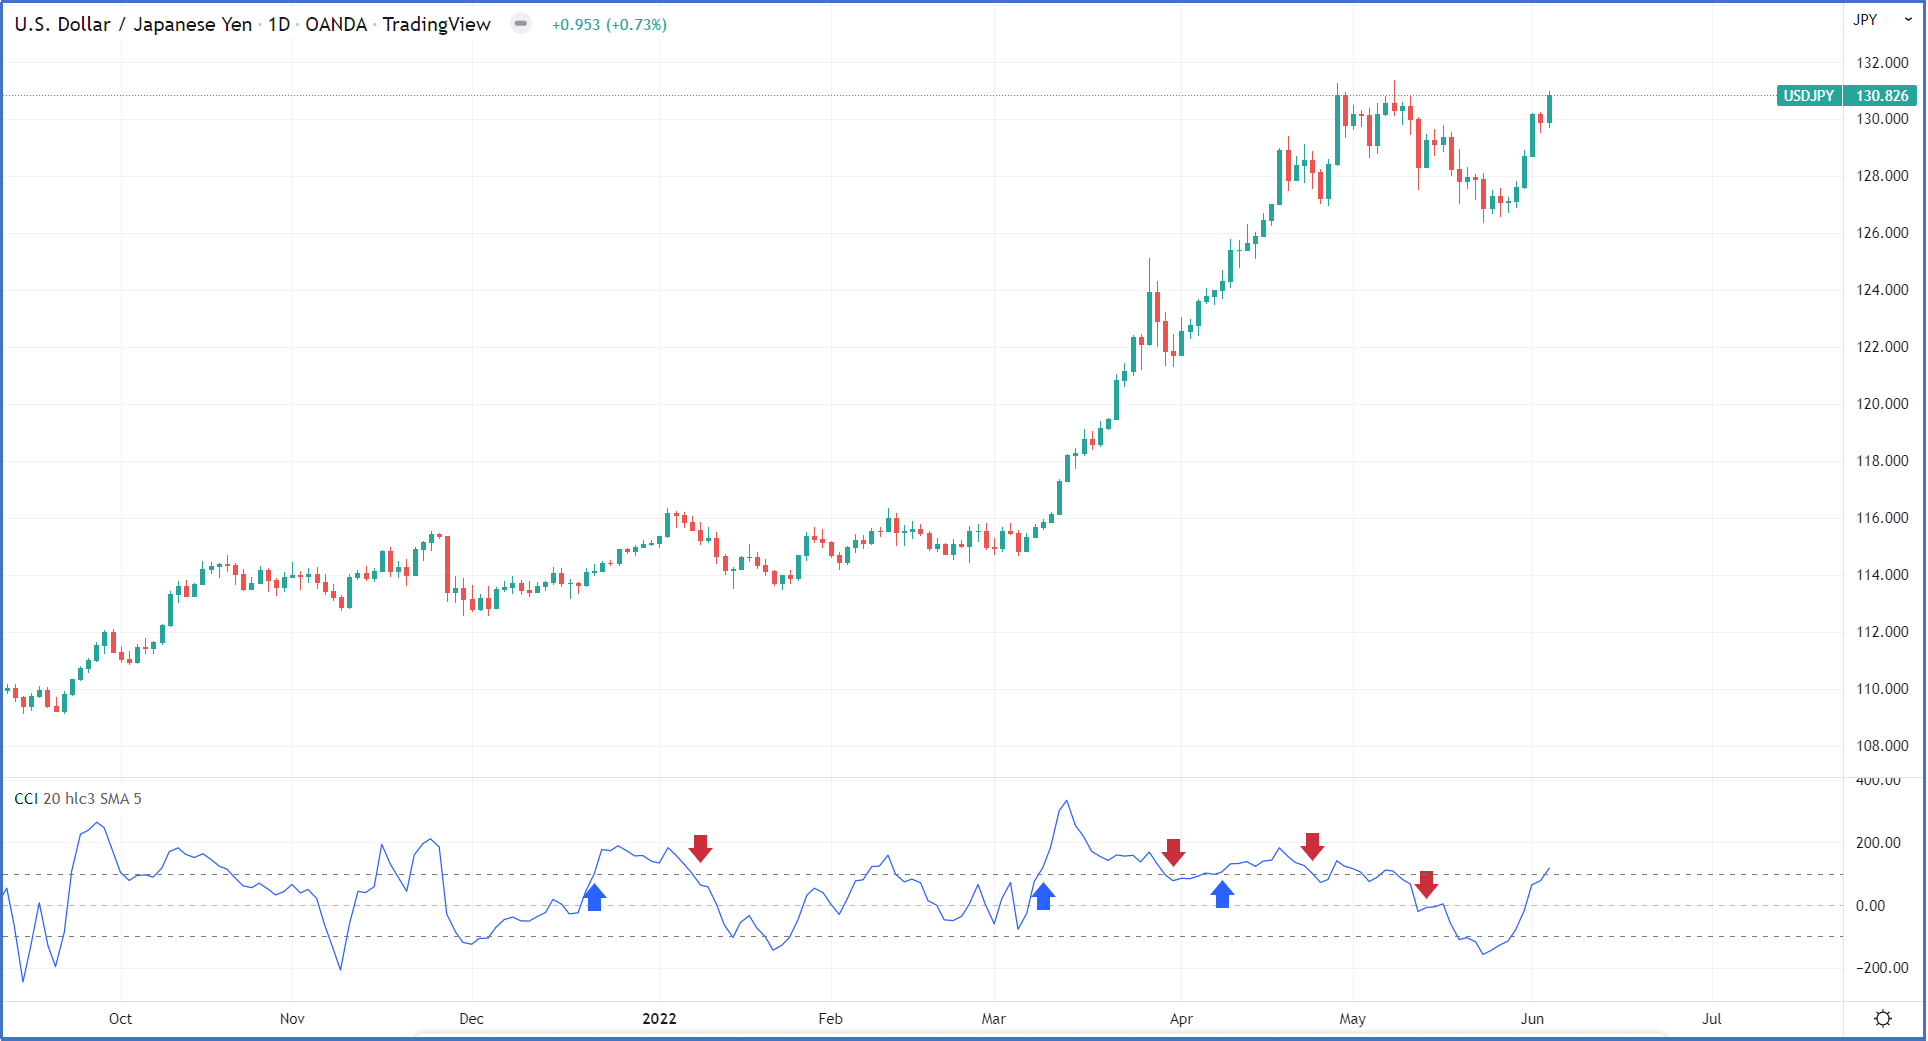
Figure 7
Please click For bigger size
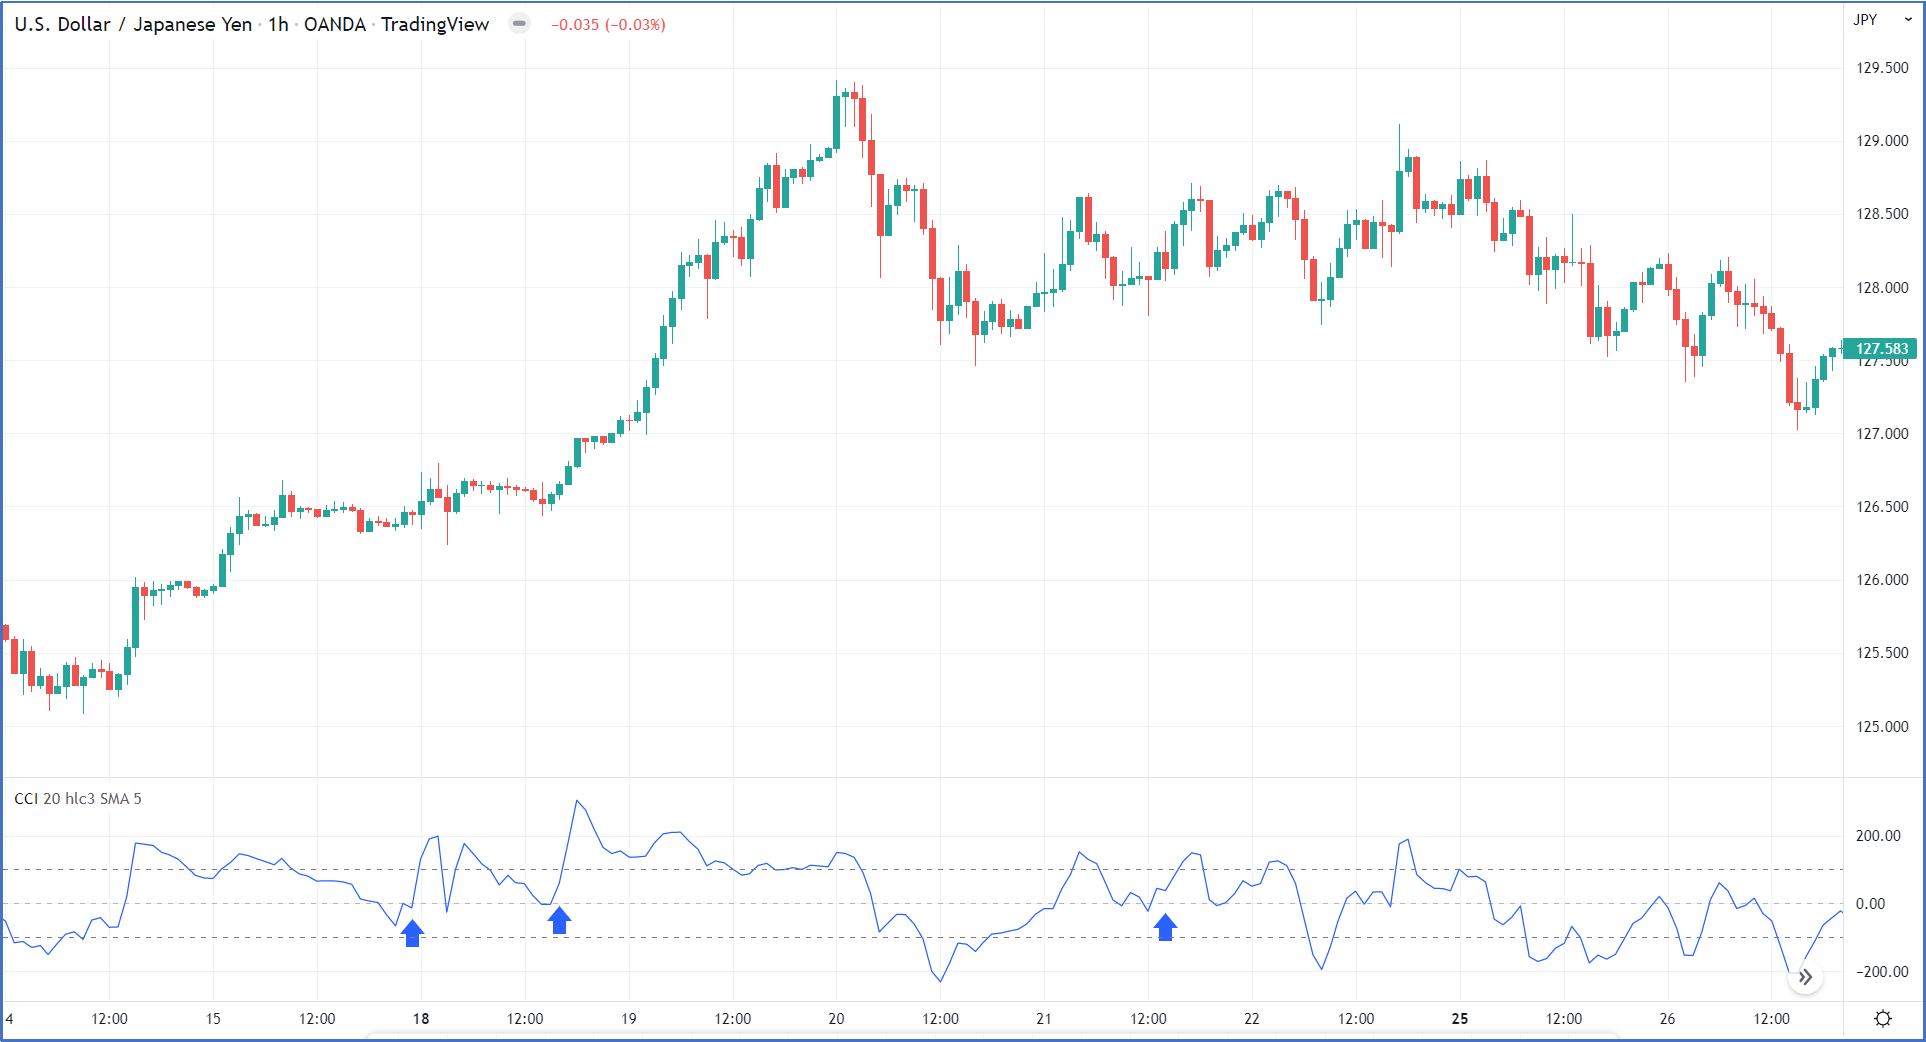
Figure 8
Please click For bigger size
In a normal uptrend, the CCI indicator will oscillate between the 100 level -100 level as shown in figure 10
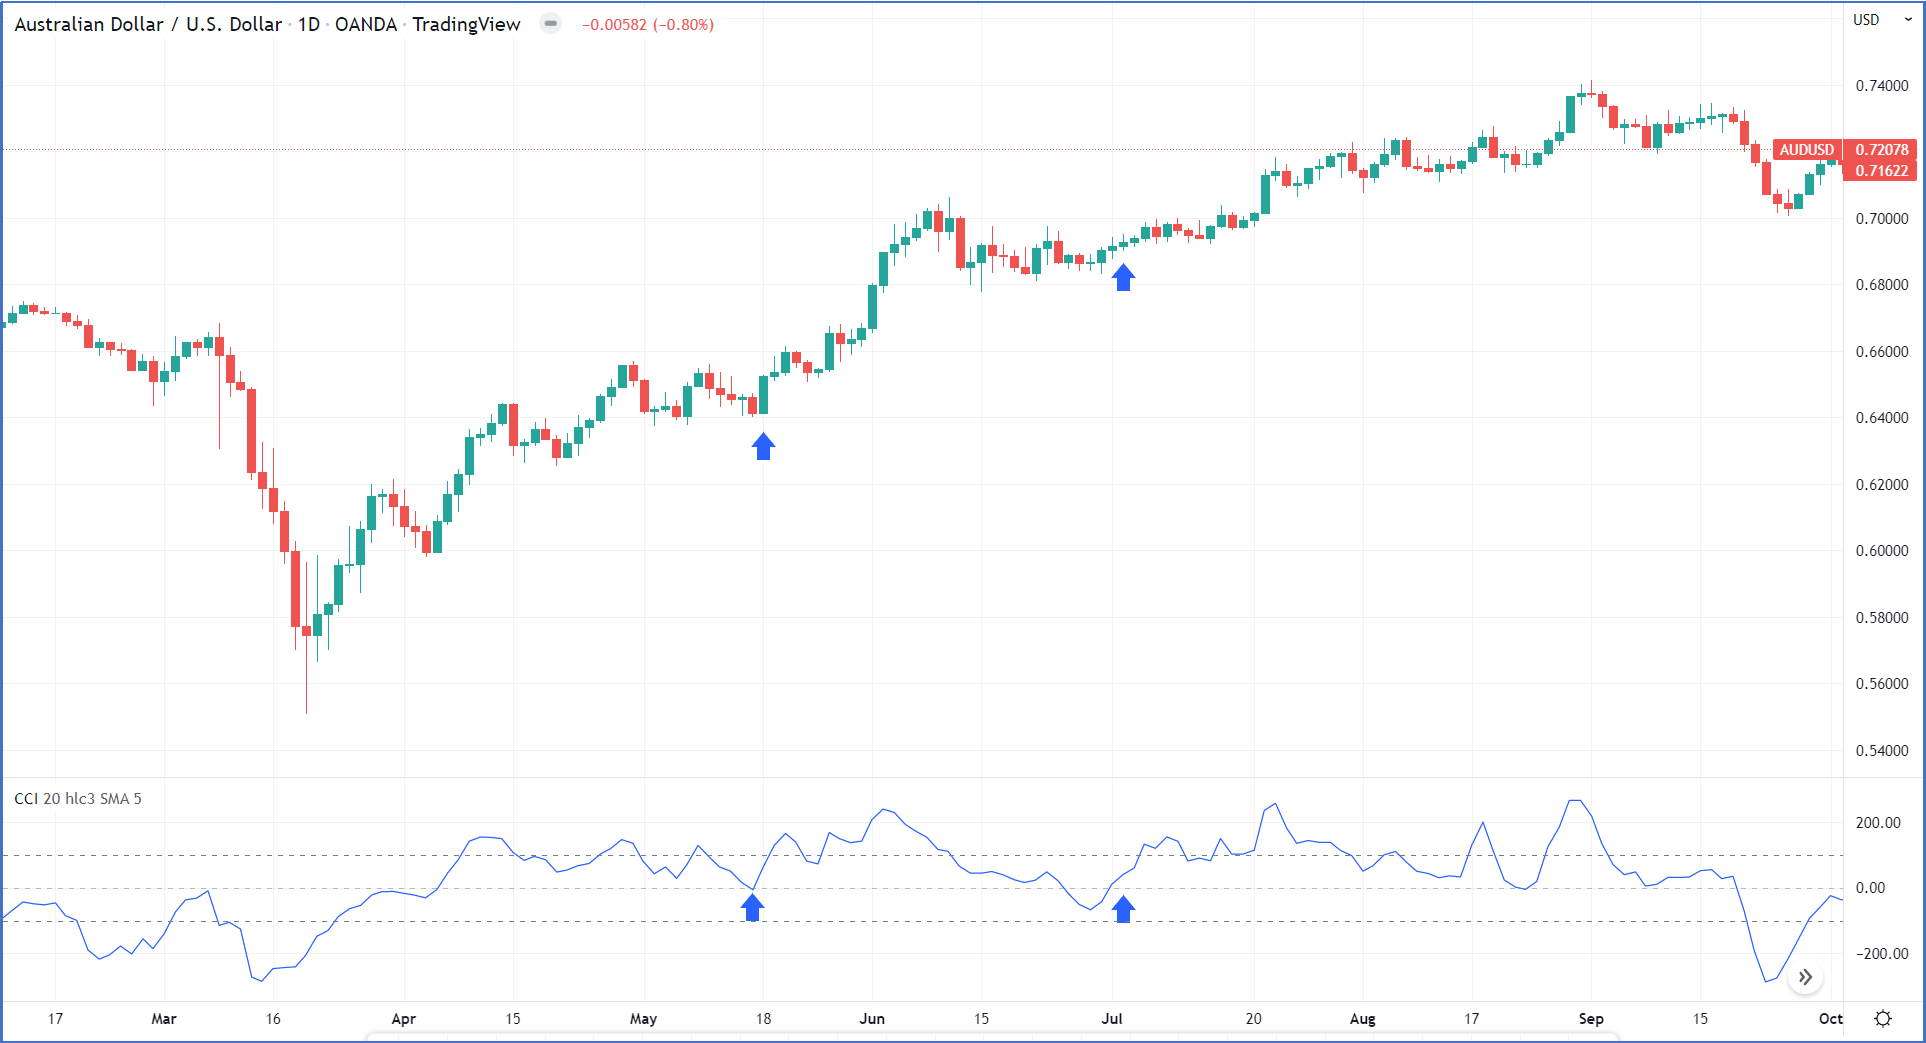
Figure 9
Please click For bigger size

Figure 10
Please click For bigger size
3- Buy signal is generated when breaking out level -100 as shown in figure 11.

Figure 11
Please click For bigger size
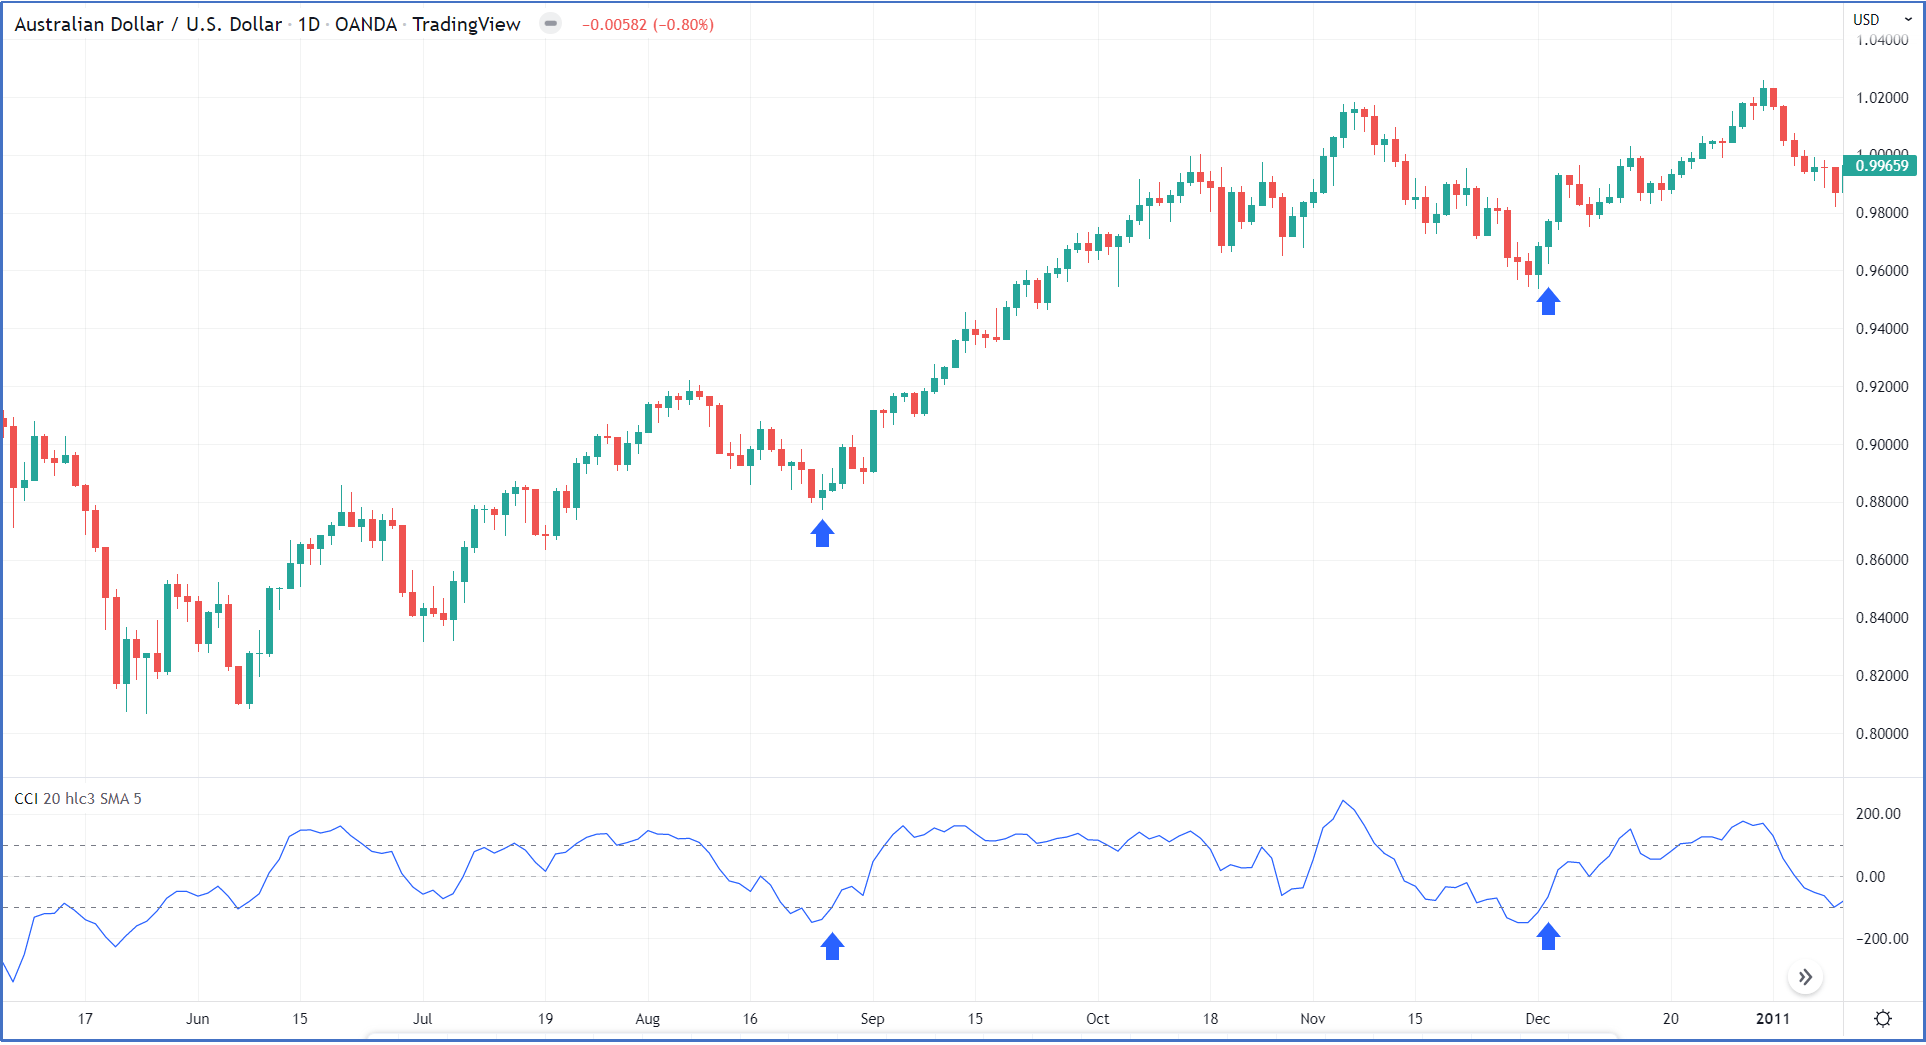
Figure 12
Please click For bigger size
How to trade using The CCI indicator in a downtrend?
During down sellers always have control over price movement and the best trades are always around the end of the upward retracement where the best risk-reward is always so CCI can be used to time the entries.
In a strong downtrend, the CCI indicator will oscillate between the -100 level and zero level as shown in figure 13.

Figure 13
Please click For bigger size
1- A sell signal is generated when breaking down level -100 and closing the position when the CCI moves above level -100 or the zero line. As shown in Figure 14.

Figure 14
Please click For bigger size
2- A sell signal is generated when CCI breaks down the zero-line level but when it does not reach 100. Figure 15

Figure 15
Please click For bigger size
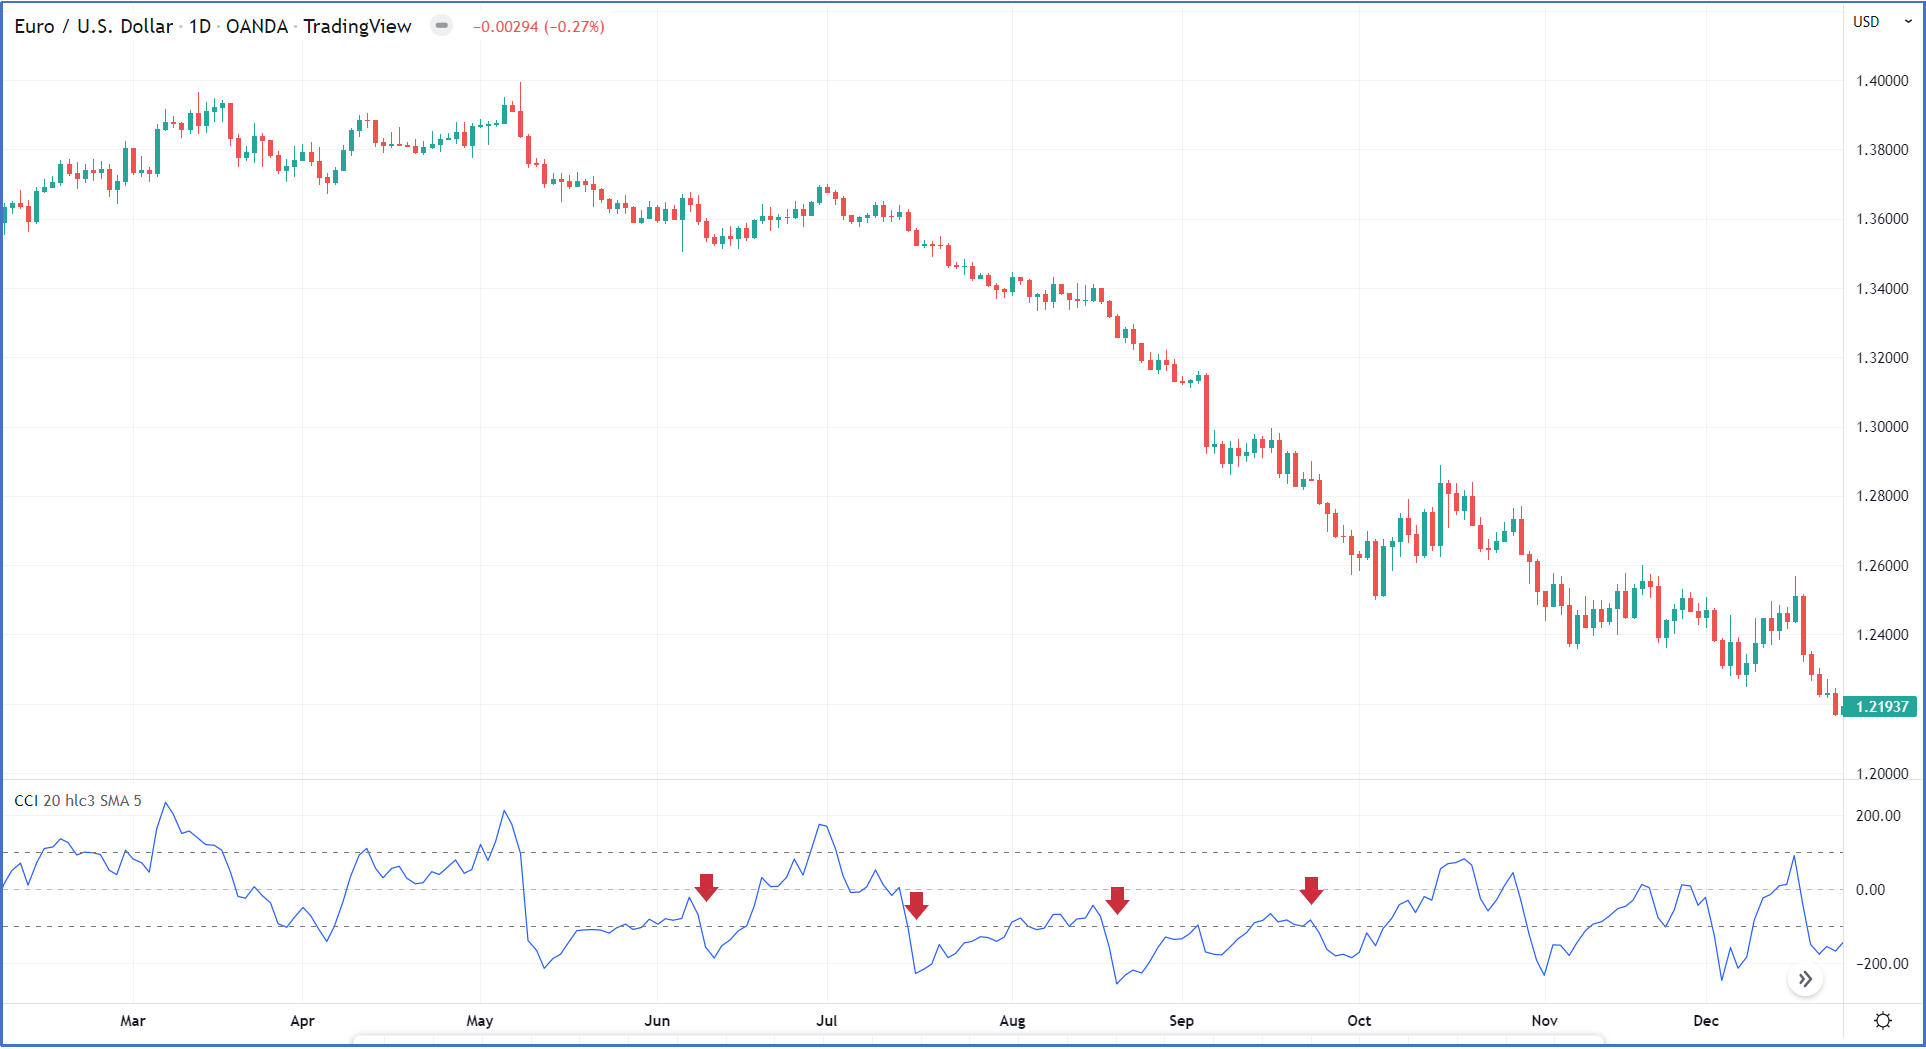
Figure 16
Please click For bigger size
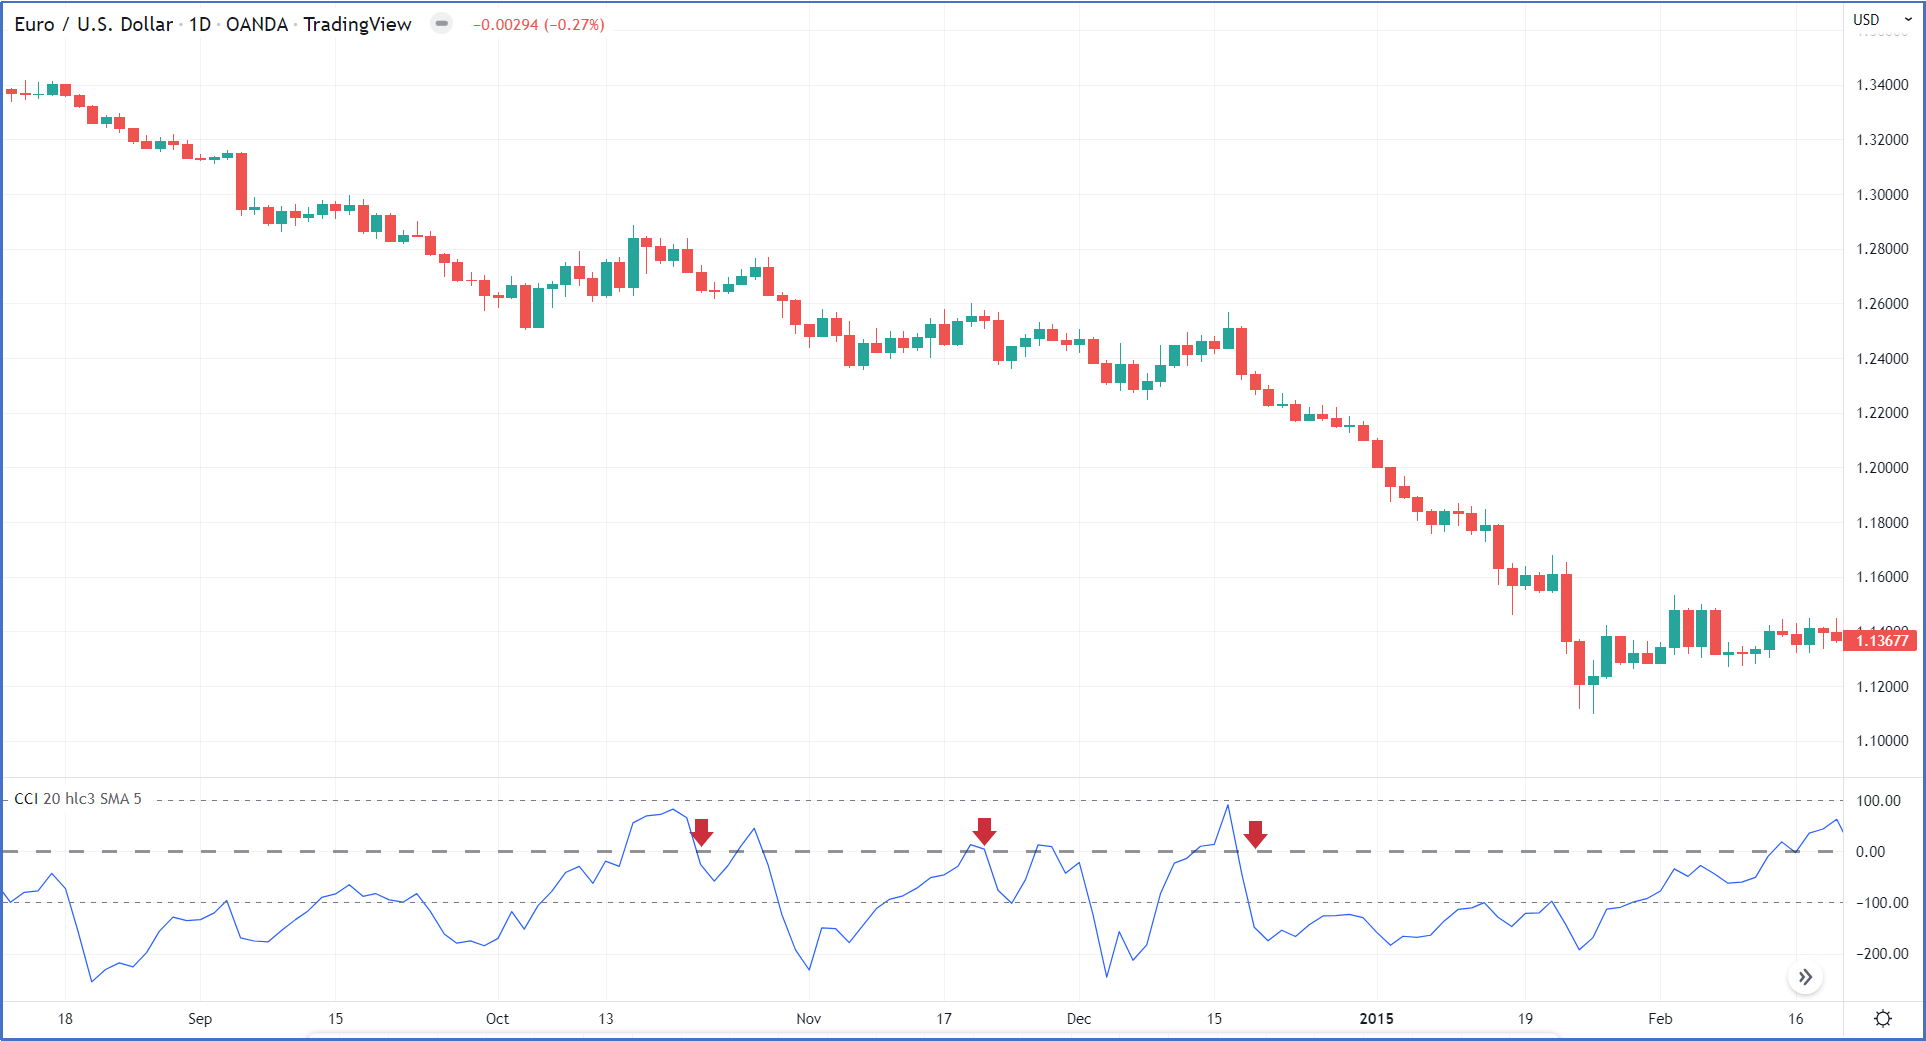
Figure 17
Please click For bigger size
In a normal downtrend, the CCI indicator will oscillate between the 100 level and -100 level as shown in figure 18.

Figure 18
Please click For bigger size
3- A sell signal is generated when breaking down level 100 as shown in figure 20.
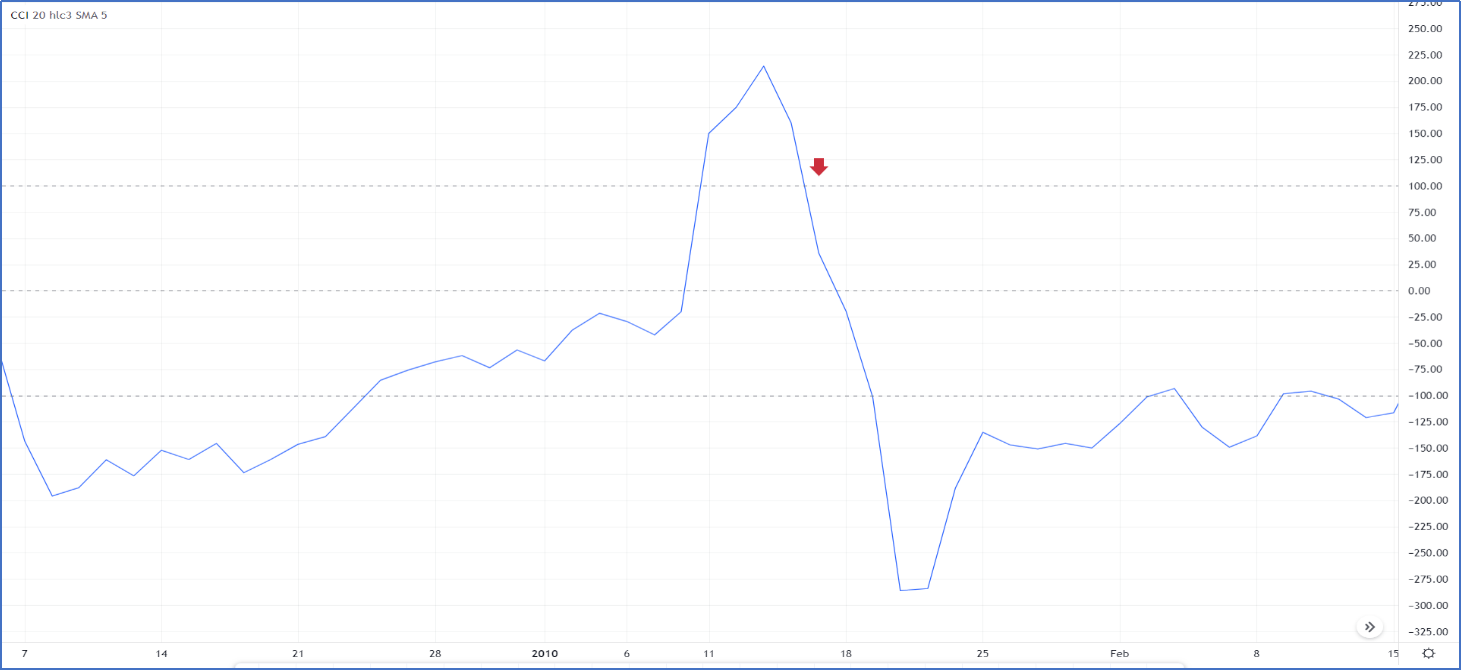
Figure 19
Please click For bigger size

Figure 20
Please click For bigger size
Overbought and Oversold zones
Identifying overbought and oversold levels can be tricky with the Commodity Channel Index (CCI), or any other momentum oscillator for that matter. First, CCI is an unbound oscillator. Theoretically, there are no upside or downside limits. This makes an overbought or oversold assessment subjective. Second, securities can continue moving higher after an indicator becomes overbought. Likewise, securities can continue moving lower after an indicator becomes oversold.
Overbought or oversold levels are not fixed since the indicator is unbound. Therefore, traders look at past readings on the indicator to get a sense of where the price reversed. For one stock, it may tend to reverse near +200 and -150. Another commodity, meanwhile, may tend to reverse near +325 and -350. Zoom out on the chart to see lots of price reversal points, and the CCI readings at those times.
Divergence using CCI Indicator
Most of the time the CCI indicator follows the price movement, but when it does not, we call this a Divergence which indicates a weakness in the current trend.
There are two types of divergence:
1-Positive Divergence
It occurs when the price makes a lower low but the indicator makes a higher low, which means the current seller is exhausted and loses momentum and a correction might occur.
2-Negative Divergence
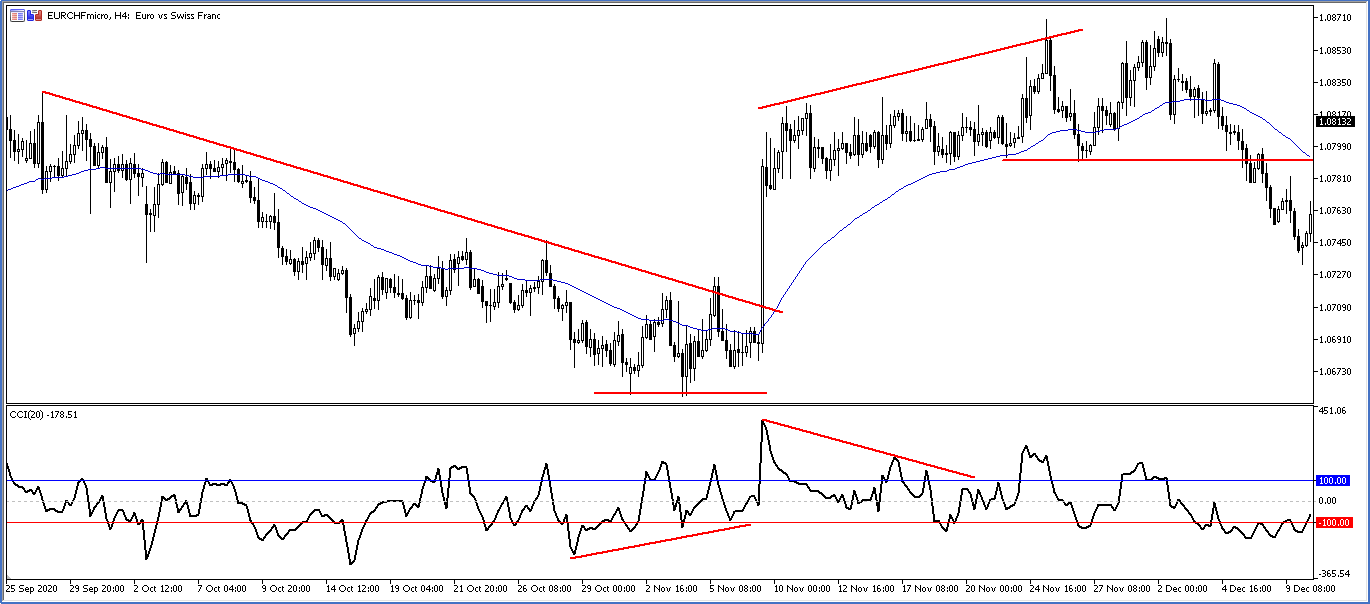
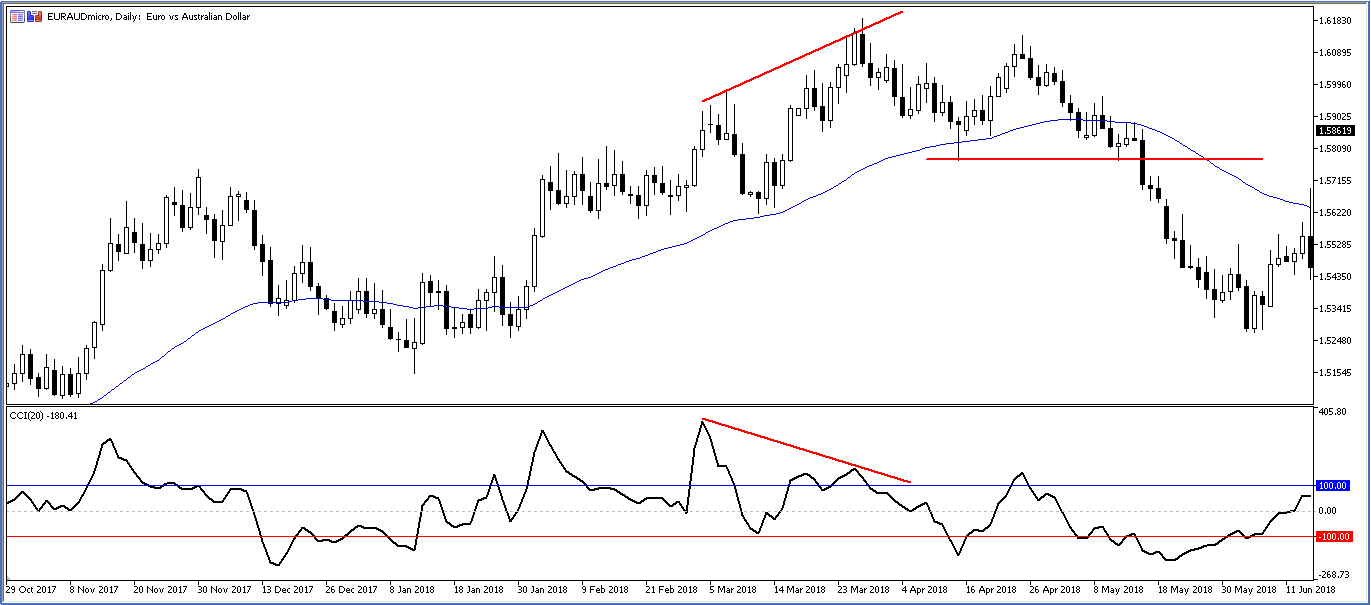
It occurs when the price makes a higher high but the indicator makes a lower high, it means the current buyer is exhausted and loses momentum and correction might occur as shown in figure 21

Figure 21
Please click For bigger size
Please click For bigger size
Please click For bigger size
The content published above has been prepared by CFI for informational purposes only and should not be considered as investment advice. Any view expressed does not constitute a personal recommendation or solicitation to buy or sell. The information provided does not have regard to the specific investment objectives, financial situation, and needs of any specific person who may receive it, and is not held out as independent investment research and may have been acted upon by persons connected with CFI. Market data is derived from independent sources believed to be reliable, however, CFI makes no guarantee of its accuracy or completeness, and accepts no responsibility for any consequence of its use by recipients.