
- Investing
 AccountsTrading DetailsKaianaHelp & Support
Intermarket analysis: The relationship between different markets

Introduction
Intermarket analysis is the study of how various financial markets are related. The four asset classes involved in intermarket analysis are stocks, bonds, commodities, and currencies. This differs from other forms of market analysis, which rely primarily on a single market approach.
For example, stock market analysts may spend their time analyzing the stock market, which include market sectors as well as individual stocks. Stock traders previously didn’t have much interest in what was happening in bonds, commodity markets, or the dollar.
Along those lines, fixed-income analysts and traders spent their time analyzing the bond market without worrying too much about other markets. Commodity traders had their hands full tracking the direction of their own markets and didn’t care much about other asset classes. Trading in currency markets was limited to futures specialists and interbank traders.
Why traders should use intermarket analysis
This analysis will help you determine whether other financial markets influence your market. For example, it’s crucial to know stocks and bonds interact and affect each other if you trade either of those assets. Intermarket analysis also plays a key role in the asset allocation process.
Investors are no longer limited to just stock, bonds, or cash. Investment options have broadened considerably. But first, let’s look at the stock vs. bond relationship.
Stocks vs. bonds relationship
The relationship between bonds and stocks is a very important link in intermarket analysis. Those two markets continually compete for investor funds. When investors are optimistic about economic trends, they favor stocks. When they’re pessimistic, they favor bonds.
Investment portfolios generally include both asset classes, but not always to the same allocation percentages. A standard portfolio usually allocates 60% to stocks and 40% to bonds. But there are times when it makes sense to overweight bonds. to overweight stocks. Before doing that, you’ll want to know how to chart the two asset classes and how to compare their relative performances.
It’s also important to understand the economic forces that drive their relative performance, such as actions by the Federal Reserve to influence interest rates.
Figure 1 shows the correlation between S&P 500 and 10-year US Treasury yield. Notice the correlation changes over time as the Federal Reserve influences interest rates.
Figure 1
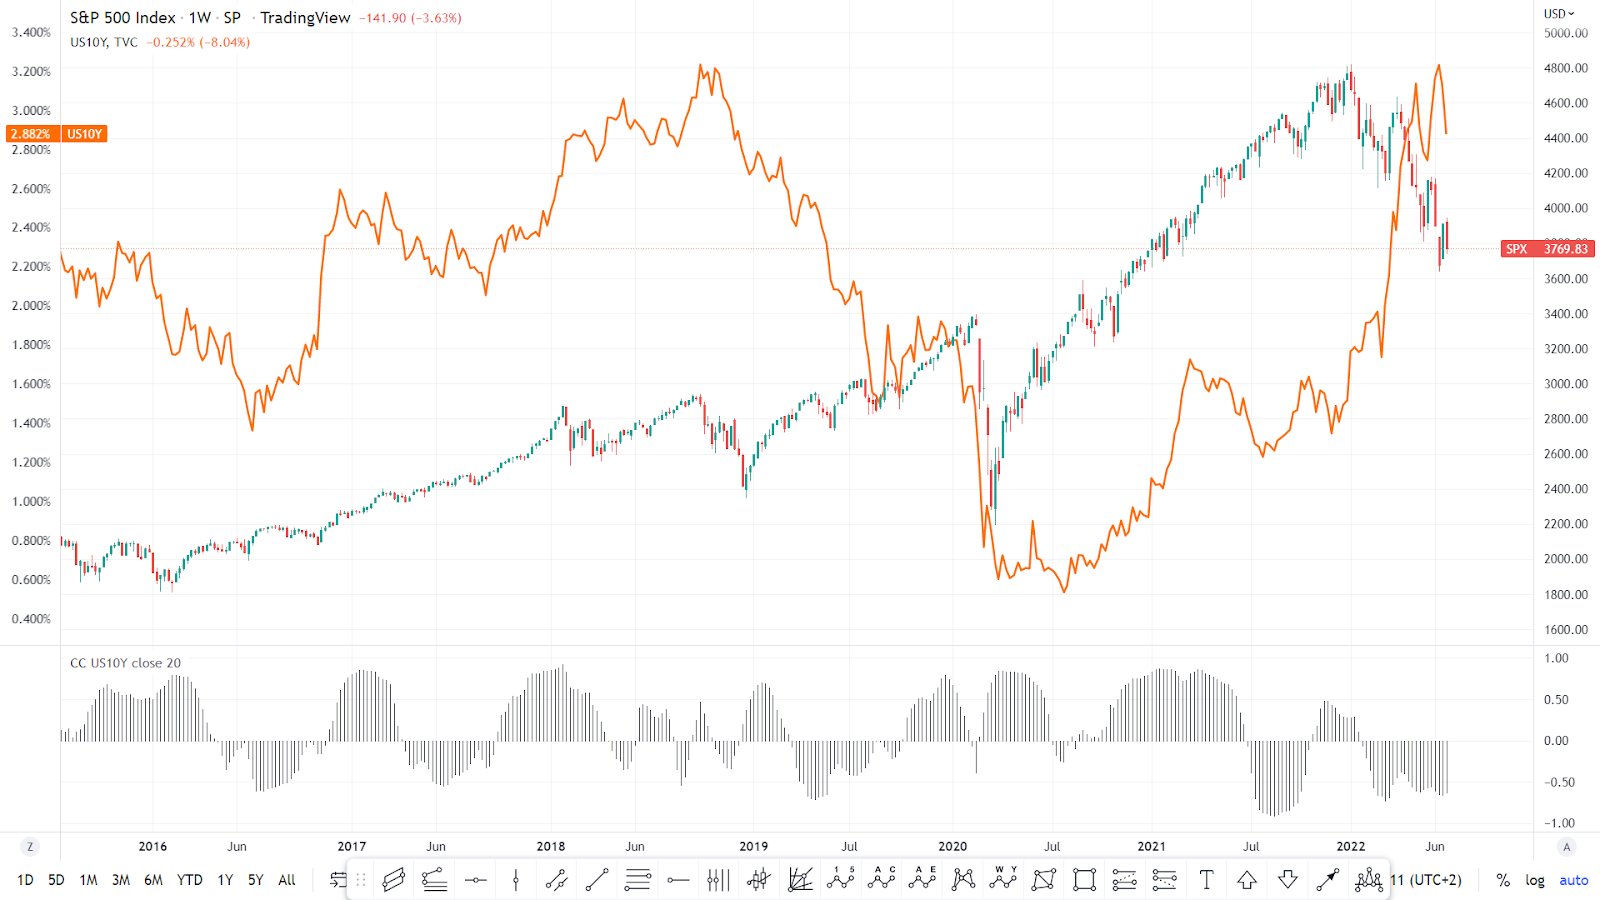
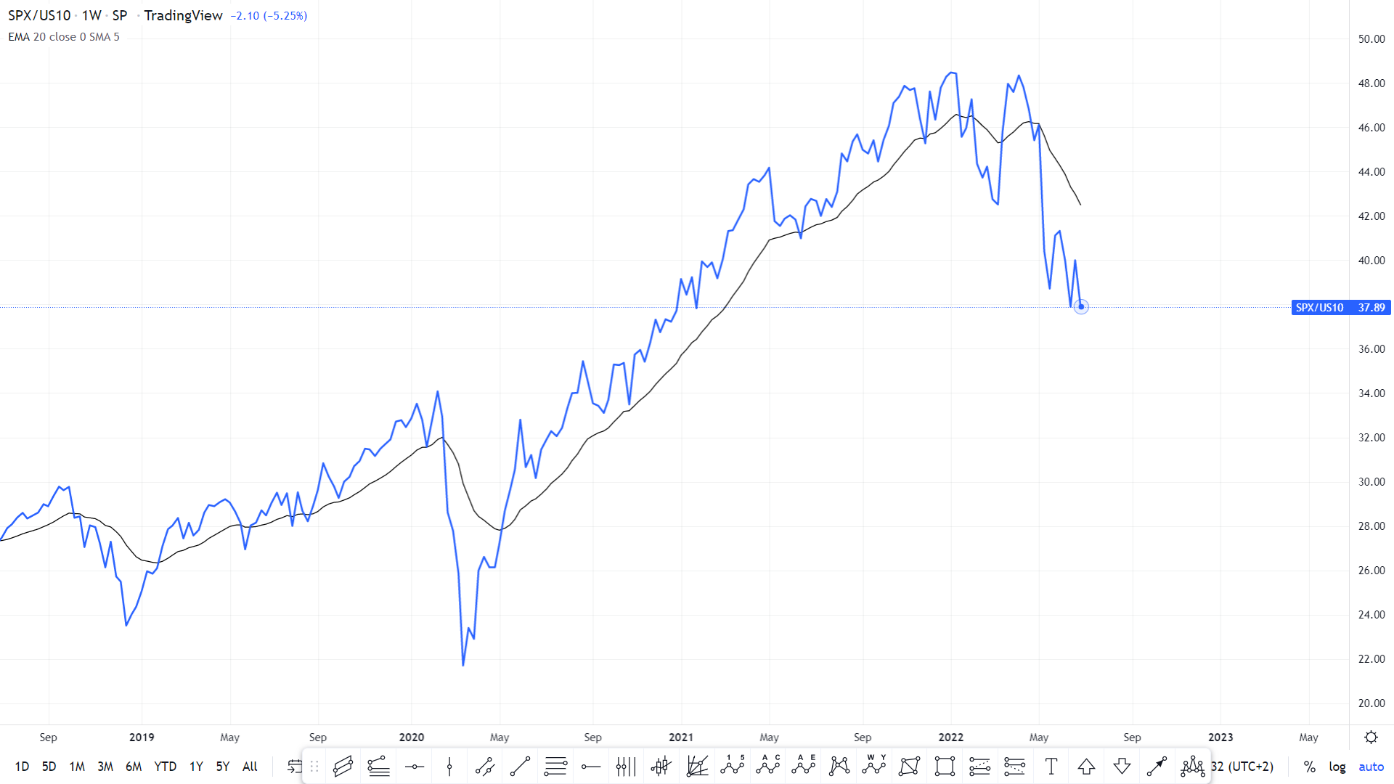
Figure 2 shows the ratio between the S&P 500 and 10-year US Treasury price. When the ratio moves in an uptrend this means stocks are outperforming the bond market—hence it’s a good time to be overweight stocks.
Figure 2
Bonds vs. commodities relationship
Bond and commodity prices normally trend in opposite directions. Treasury bond prices are very sensitive to inflation. Rising commodity prices are viewed as a leading indicator of inflation.
As a result, an inverse relationship usually exists between bond and commodity prices. In other words, bond and commodity prices normally trade in opposite directions. Rising commodity prices normally cause Treasury bond prices to fall, and vice versa.
The CRB Index was first published by the Commodity Research Bureau in 1958. The Thomson Reuters/Jefferies CRB Index includes 19 commodities, all of which are traded on exchanges in the United States and London. The CRB Index formula includes commodity contracts that lie within six months of the current date.
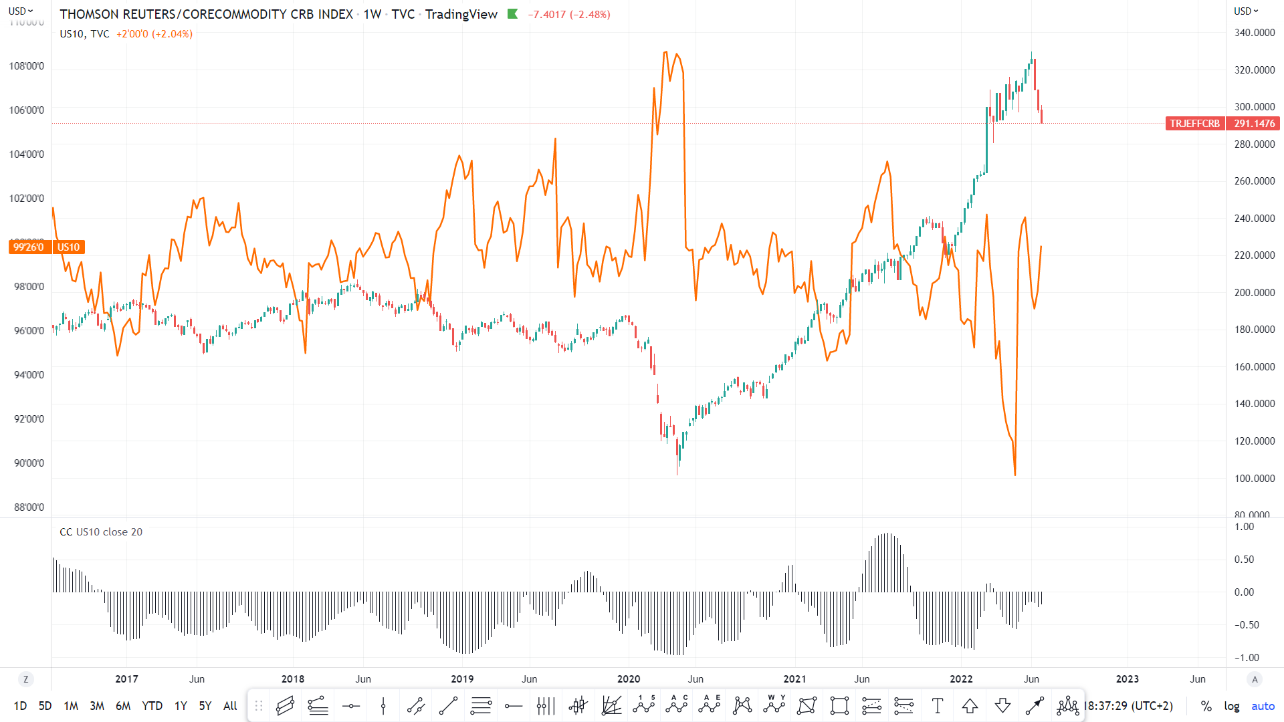
Figure 3 shows the relationship between the CRB index and the 10-year US Treasury price; note the overall negative correlation of the two.
Figure 3
Bond prices are closely tied to the direction of the economy. As a result, a weaker economy produces higher bond prices (and lower bond yields). Conversely, a stronger economy results in weaker bond prices (and stronger bond yields).
Of the 19 commodities in the CRB Index, copper is the most closely tied to the economy. As a result, copper trades closely with the bond market.
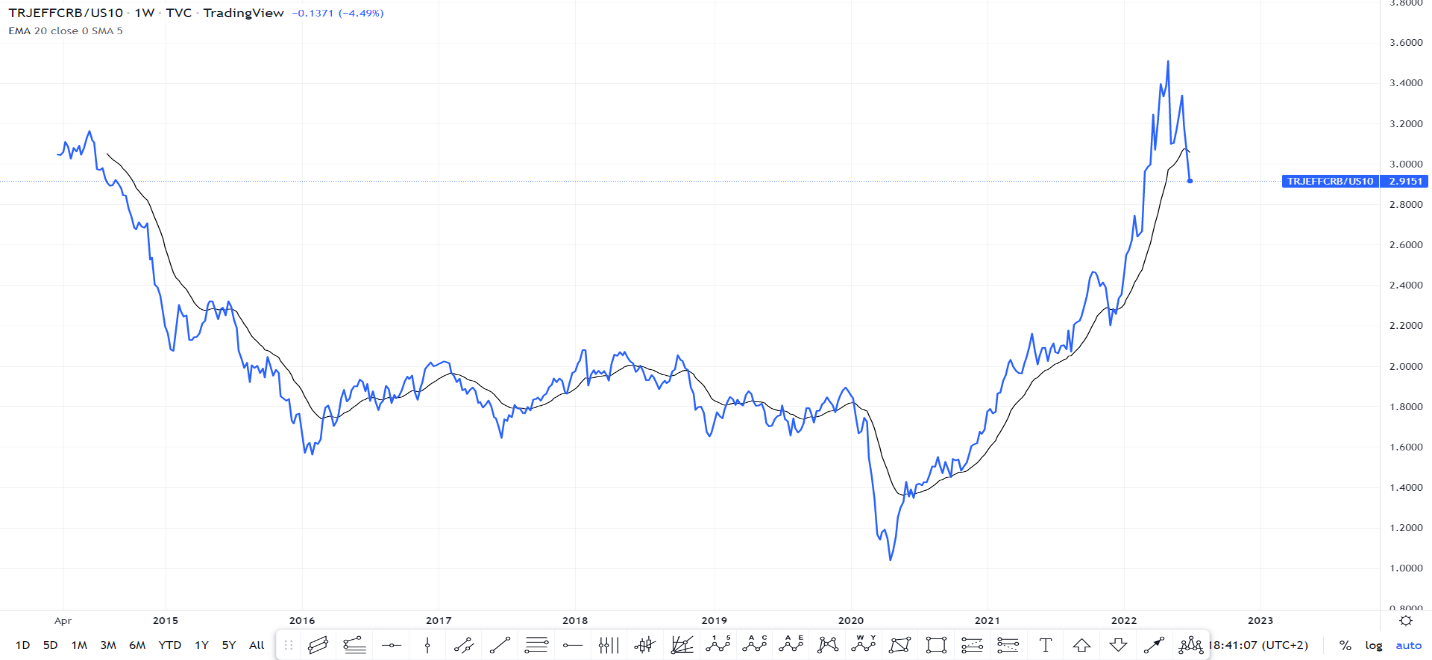
Figure 4 shows the ratio between the CRB index and 10-year US Treasury. When the ratio moves in an uptrend it means commodities are outperforming the bond market and it is a good time to be overweight commodities.
Figure 4
Stocks vs. commodities relationship
The two markets usually trend together, and the correlation between the two is usually always positive. Figure 5 shows the relationship between the CRB index and stock prices; note the positive correlation.
Figure 5
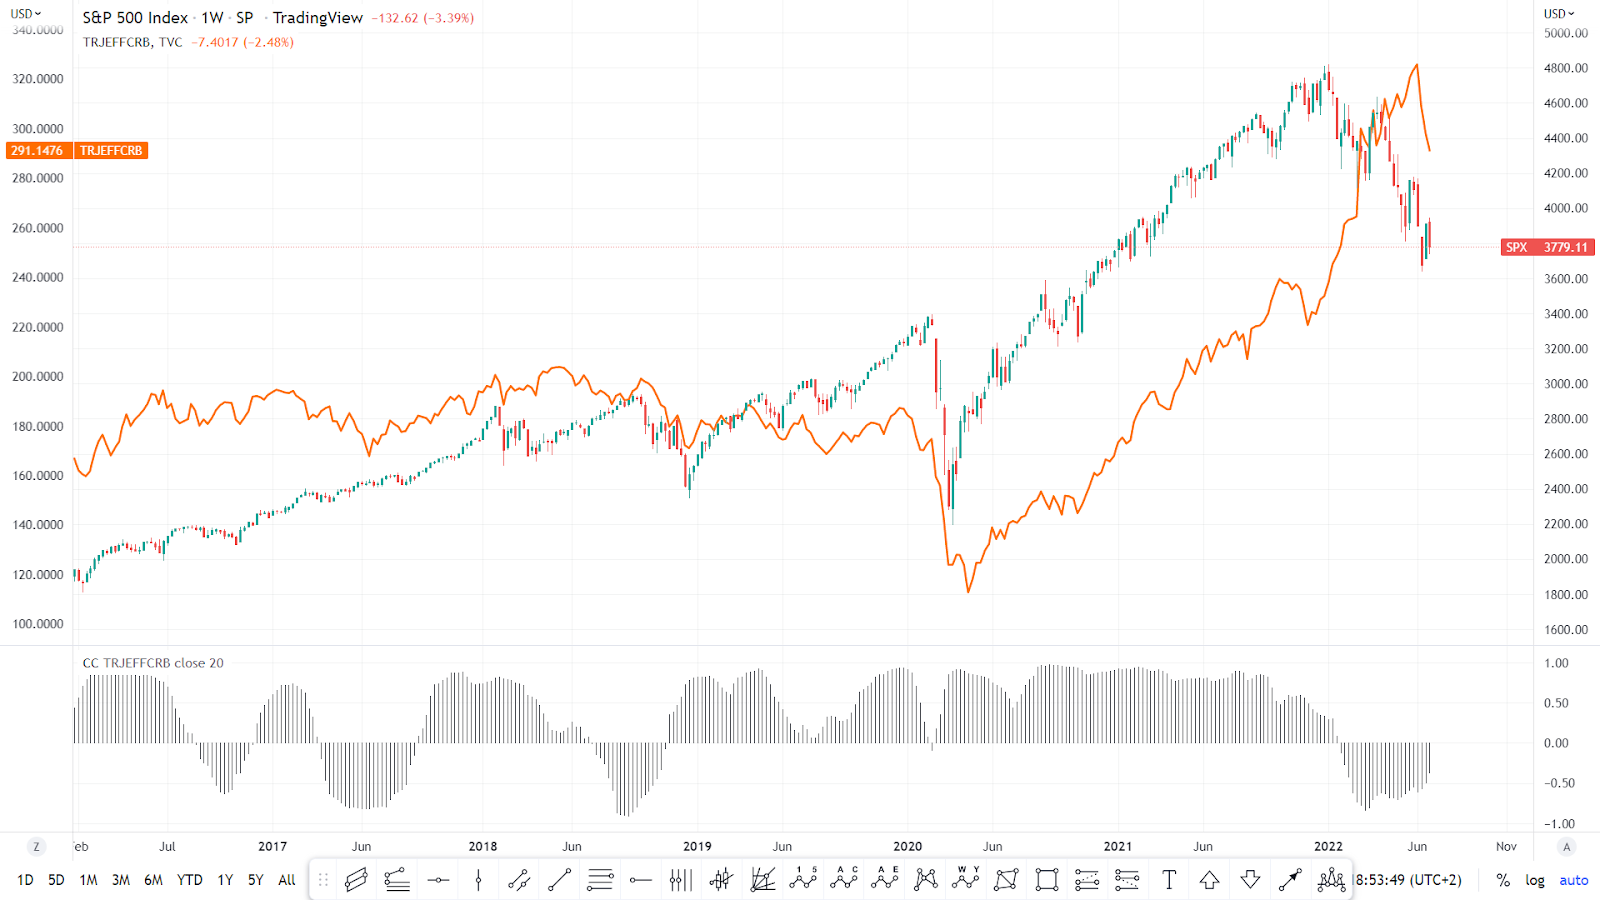
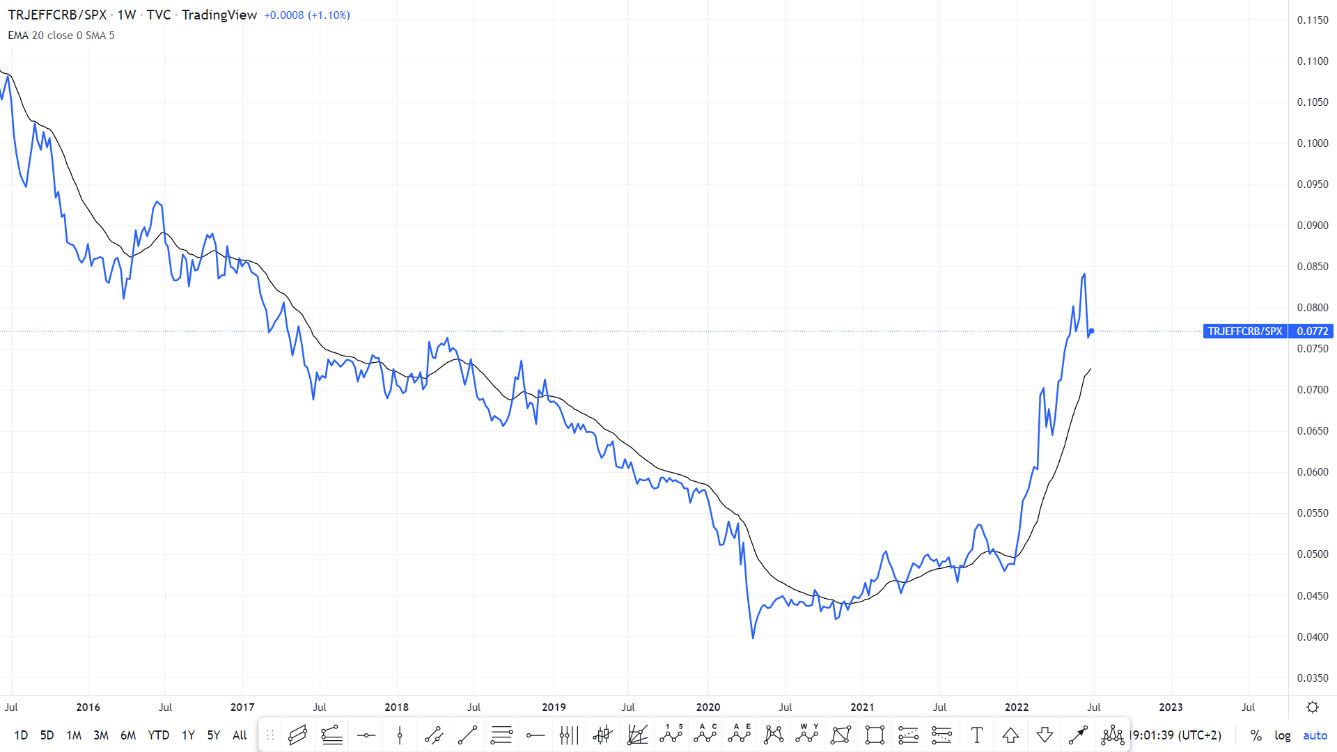
Figure 6 shows the ratio between the CRB index and stock prices. When the ratio moves in an uptrend it signals commodities are outperforming the stock market and it is a good time to be overweight commodities.
Figure 6
Intermarket correlation analysis benefits
The use of Intermarket correlation analysis can help you improve your trading system by avoiding trades against the prevailing direction of correlated markets. The analysis can also be used on its own to develop a trading system based on the divergences between two or more highly correlated markets.
Knowing the correlations of the market you plan relative to other markets is very important for predicting its future direction.
In addition, short-term traders can take advantage of the time difference between markets and anticipate the next day’s movement. Asian markets are the first to start trading, followed by European markets. For a US trader, the insight gained from all preceding markets is a valuable tool in predicting at the opening of their local market.
Intermarket correlation and economic cycles
Intermarket analysis can also be useful in estimating the duration and state of the business cycle by watching the historic relationship between bonds, stocks, and commodities as a slowing economy favors bonds, versus stocks and commodities.
Near the end of an economic expansion bonds usually turn down before stocks and commodities, and the reverse is true during an economic expansion.
Bonds are usually the first to peak and the first to bottom and can therefore provide ample warning of the start (or end) of a recession.
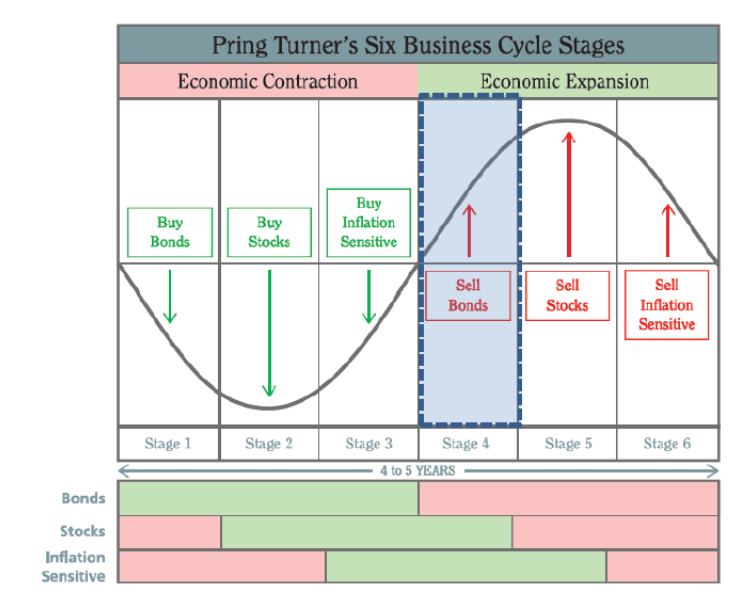
Bonds have an impressive record as a leading indicator for the stock market, as seen in Figures 7 and 8, although this information cannot be used in constructing a trading system as the lead times can be quite long, ranging from one to two years.
Figure 7
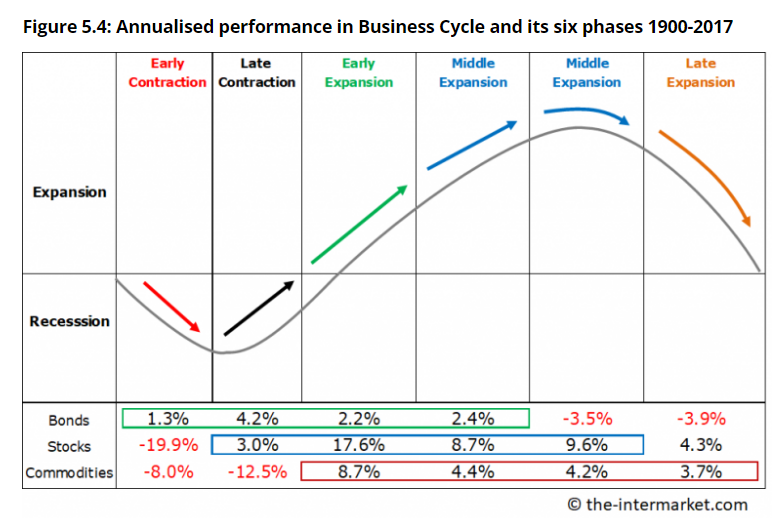
Figure 8
Conclusion
Intermarket analysis is all about relationships. As a result, it’s an increasingly important part of technical analysis. Correlations between the various financial markets over the past few years have gotten so strong that it’s nearly impossible to understand what’s happening in any one market without knowing what’s also happening in other markets.
Disclaimer: The content published above has been prepared by CFI for informational purposes only and should not be considered as investment advice. Any view expressed does not constitute a personal recommendation or solicitation to buy or sell. The information provided does not have regard to the specific investment objectives, financial situation, and needs of any specific person who may receive it, and is not held out as independent investment research and may have been acted upon by persons connected with CFI. Market data is derived from independent sources believed to be reliable, however, CFI makes no guarantee of its accuracy or completeness, and accepts no responsibility for any consequence of its use by recipients.


