
- Specials
 AccountsTrading DetailsCFI AIHelp & SupportPartnership
How to Trade using Ichimoku Kinko Hyo

Introduction
The charting system of Ichimoku Kinko Hyo was developed by a Japanese newspaperman named Goichi Hosoda. He began developing this system before World War II, with the help of numerous students that he hired to run through the formulas and scenarios (like how we would use computer-simulated back testing today to test a trading system).
The system itself was finally released to the public in 1968, after more than twenty years of testing, when Mr. Hosoda published his book, which included the final version of the system.
Ichimoku Kinko Hyo has been used extensively in Asian trading rooms since Hosoda published his book and has been used successfully to trade currencies, commodities, futures, and stocks.
Even with such wild popularity in Asia, Ichimoku did not make its appearance in the West until the 1990s and then, due to the lack of information in English on how to use it, it was mostly considered an "exotic" indicator.
Only now, in the early 21st century, are western traders really beginning to understand the power of this charting system. Ichimoku is a lagging indicator, however, its methodology allows the traders to determine the market trend, an entry-level, and ways to close it.
Loosely translated, Ichimoku chart means a ‘one glance equilibrium’ chart. Once a trader is familiar with the components of an Ichimoku system, it should take no more than a glance to decide if the chart is bullish or bearish. This was the purpose with which Goichi Hosoda invented for the system. Goichi wanted to create an all-in-one indicator to visually depict the market’s sentiment in the chart.
Ichimoku components
The Ichimoku system has five components to it:
1. Tenkan-Sen line (turning line)
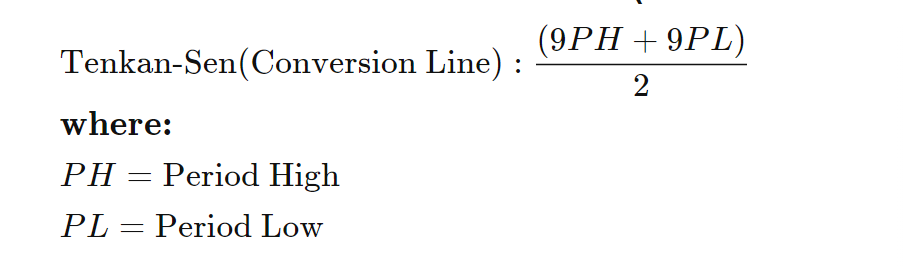
Tenkan-Sen line, also called the turning or conversion line, presents the short-term average. The average is the midpoint of the 9-day trading range. The formula is shown in Figure 1.
Figure 1
2. Kijun-Sen line (base line)
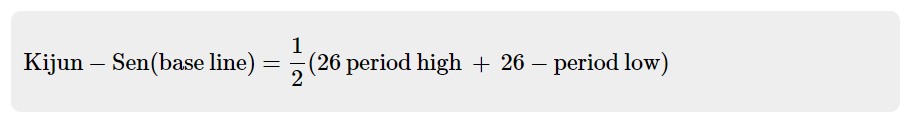
The base line is the midpoint of 26 days. It presents a medium-term average of prices, also known as the Standers Line. The direction of the baseline should be taken as the direction of the market. A rally not accompanied by an upturn in the baseline ends up short-lived, even if the conversion line has crossed above the baseline. The formula is shown in Figure 2.
Figure 2
3. Senkou span A (leading span A)
Tenkan-Sen line and Kijun-Sen line have a valuable contribution to building the body of the Ichimoku cloud. The coud is made up of two lines called span A and span B. The first Span of the Ichimoku cloud is the leading Span A (fast span), which is the midpoint of the Tenkan-Sen line and the Kijun-Sen line shifted 26 bars ahead. The Span a formula is (Tenkan-Sen + Kijun-Sen) / 2.
4. Senkou span B (leading span B)
The span B is not related to either the Tenkan-Sen line or Kijun-Sen line. The span B is the midpoint of the past 52 trading days. Senkou span B is similar to a 50% retracement level and is the midpoint of the last 52 days. The area between span A and Span B is the Ichimoku cloud’s body, which is shaded or hatched with lines.
The cloud’s body is the area, the gap, between Senkou span A and Senkou span B. Cloud’s color (bullish or bearish), will be determined depending on the relation between the span A and span B. If span A (fast) is above span B (slow), indicating prices increase (bullish movement), the cloud’s color would be green or blue as a positive color. On the other hand, if span A is below span B, this indicates for prices decrease (bearish movement), and the cloud color would be red as a negative color. The cloud should be moved ahead 26 days in order to draw the future support and resistance levels.
The clouds have a variety of uses and add a completely new dimension to the standard candlestick chart. Firstly, if today’s candle is above the cloud, the trend is for higher prices. The top of the cloud is the first level of support, and the bottom is the second level of support. The opposite is the case when candles are below the Cloud, with this becoming the area of resistance.
Here's what you need to know about the cloud:
- When the prices are above the cloud it’s an uptrend
- When the prices are below the cloud it’s a downtrend
- When the price trades within the cloud, the cloud boundaries (span A and B) act as support and resistance level until the prices get out of the cloud.
5. Chikou Span (lagging span)
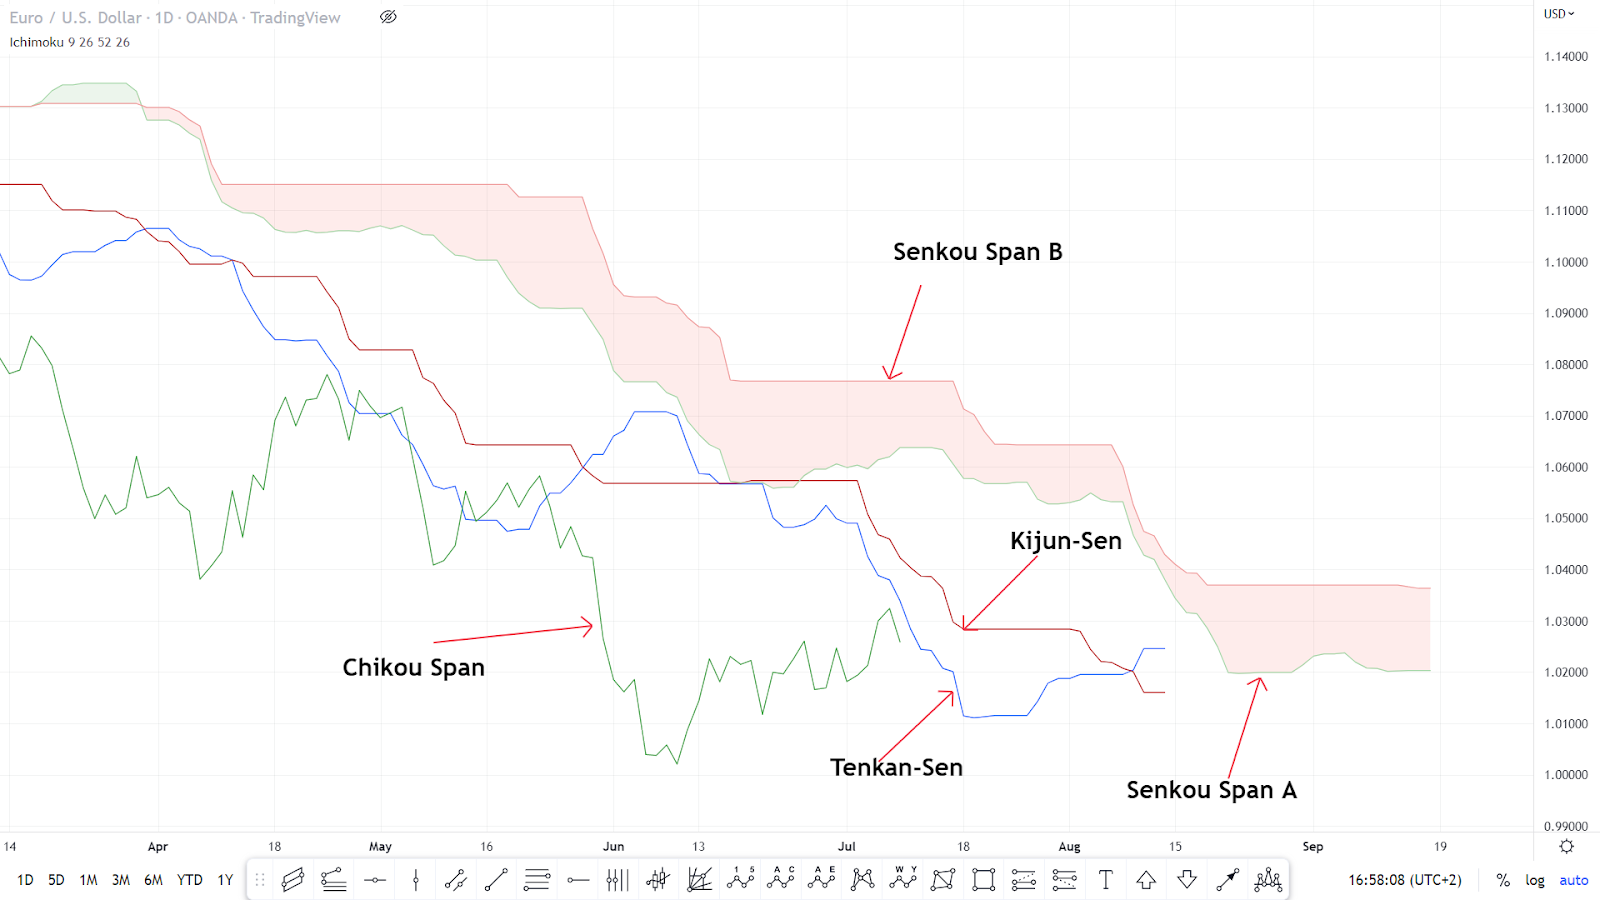
Chikou span is the fifth line of the Ichimoku chart. Chikou span is the recent close price plotted 26 days backward. It is always lag-behind the current price. It presents the momentum and confirms the trend when the prices cross the cloud, shown in Figure 3.
Figure 3
Ichimoku charts are built around candlestick charts with the following five lines added:
- Tenkan-Sen (Highest High + Lowest Low)/2, for the past 9 periods
- Kijun-Sen (Highest High + Lowest Low)/2, for the past 26 periods
- Senkou Span A (Tenkan-Sen + Kijun-Sen)/2, plotted 26 periods ahead
- Senkou Span B (Highest High + Lowest Low)/2, for the past 52 periods, plotted 26 periods ahead
- Chikou Span Today’s closing price plotted 26 periods behind.
Ichimoku Trading Strategies
Short-term strategies
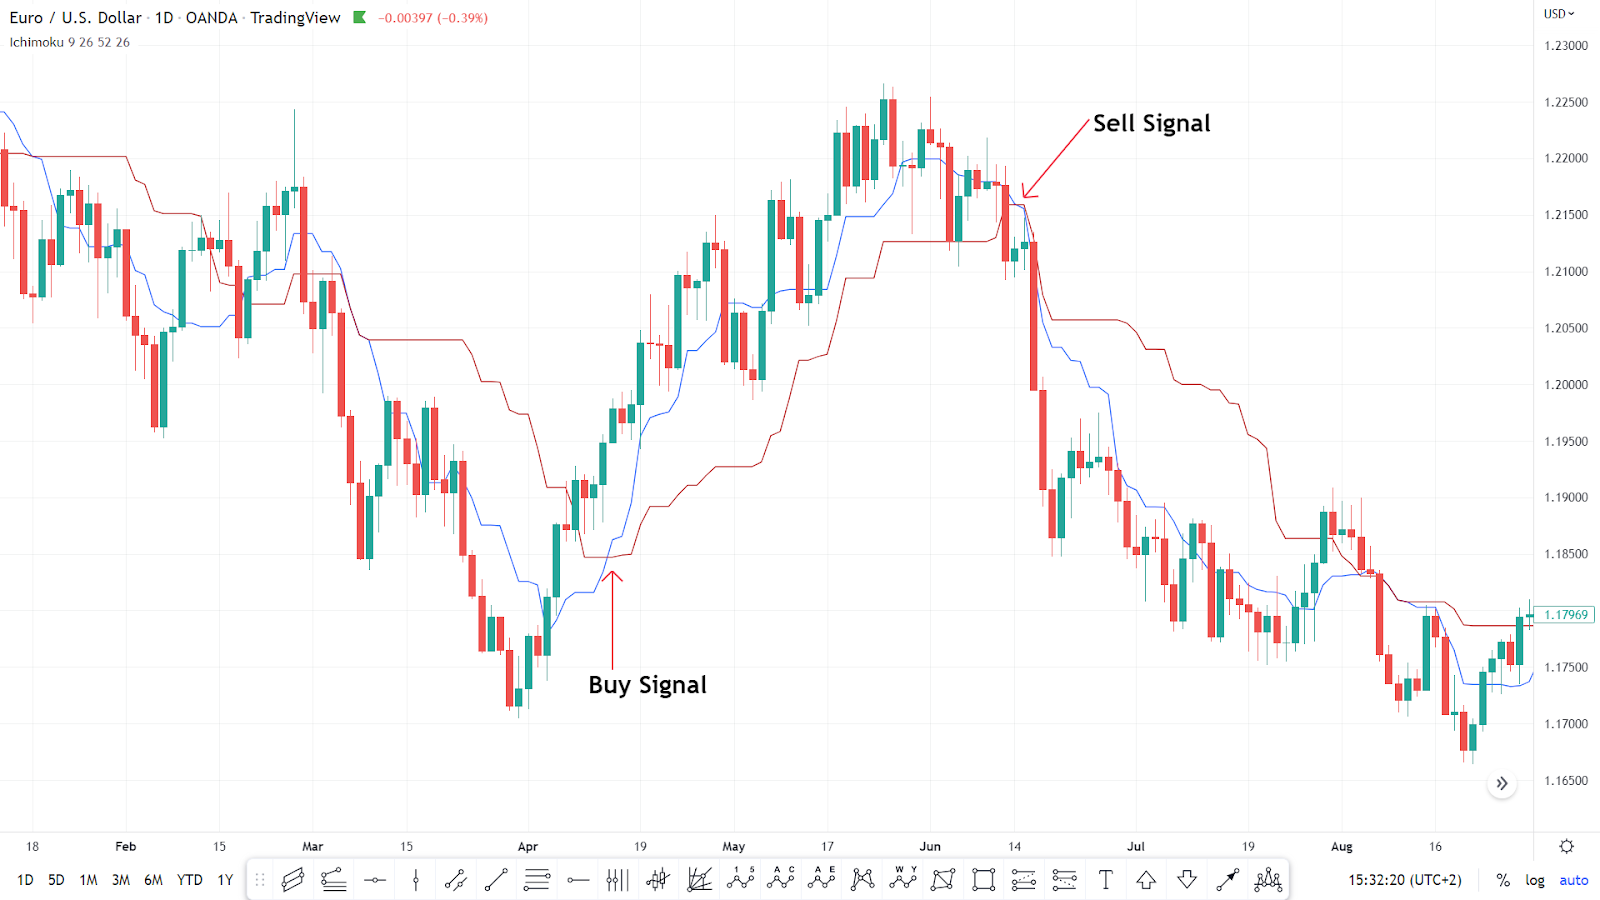
The keys for the short-term trading strategy, seen in Figure 4, are:
- Signal: Conversion line > base line, stop loss: Base Line
- Signal: Conversion line < base line, stop loss: Base Line
Figure 4
Medium-term strategies
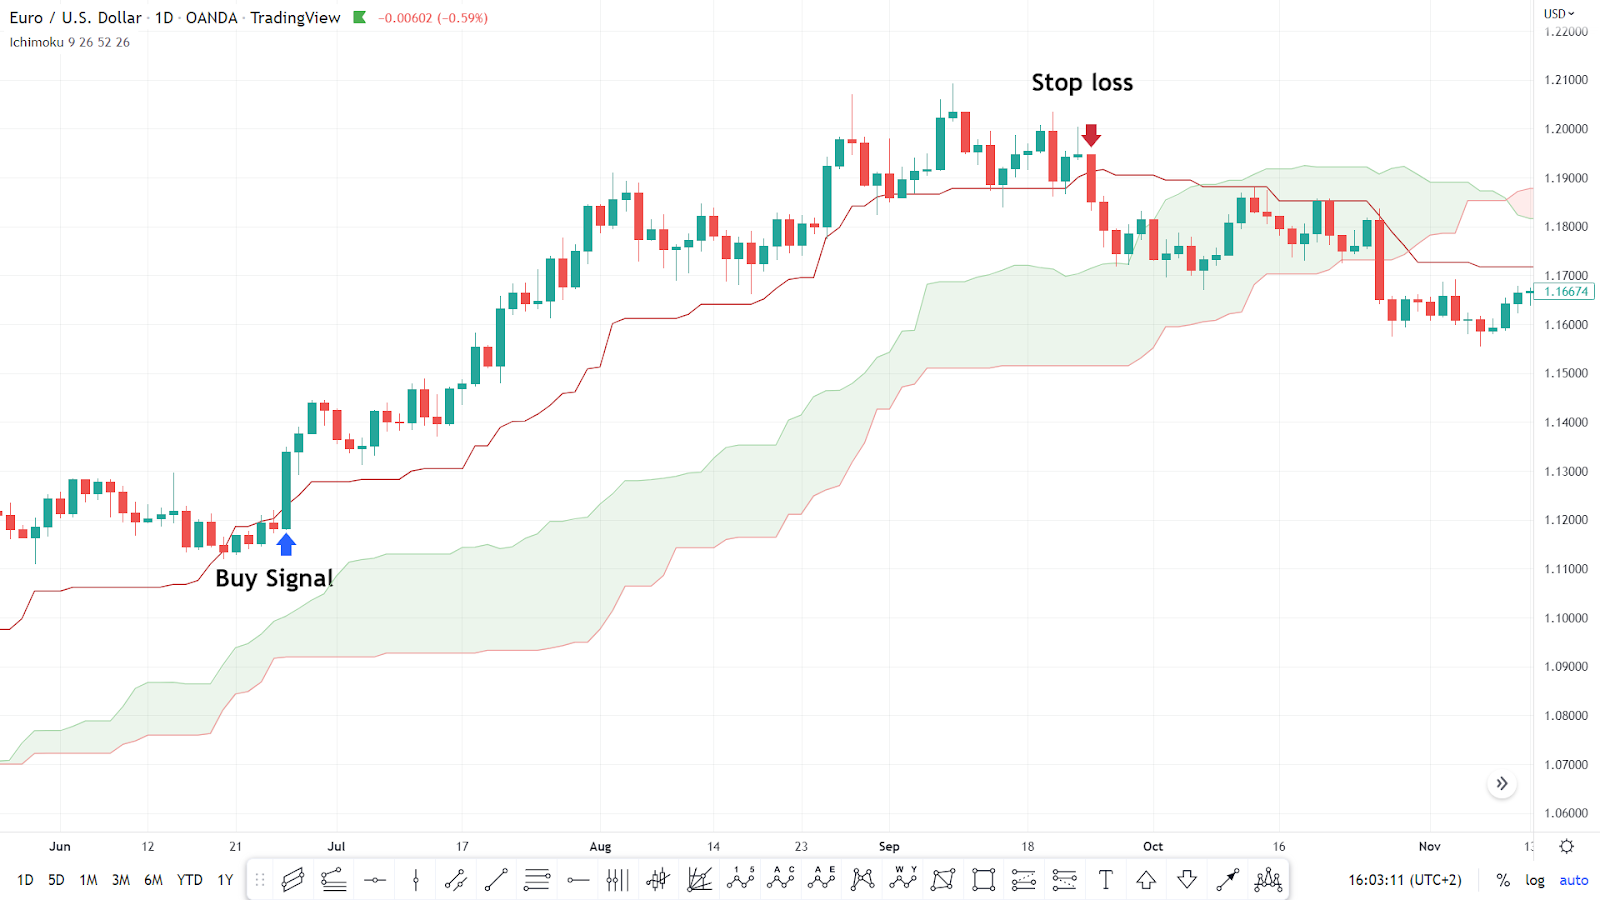
Here’s the setup for medium-term strategies, seen in Figures 5 and 6.
- Setup: Price > Cloud, Signal: Base Line > Cloud Stop loss
- Base Line Re-entry: Price > Base Line > Cloud
- Setup: Price < Cloud Signal: Base Line < Cloud Stop loss
- Base Line Re-entry: price < Base Line < Cloud
Figure 5
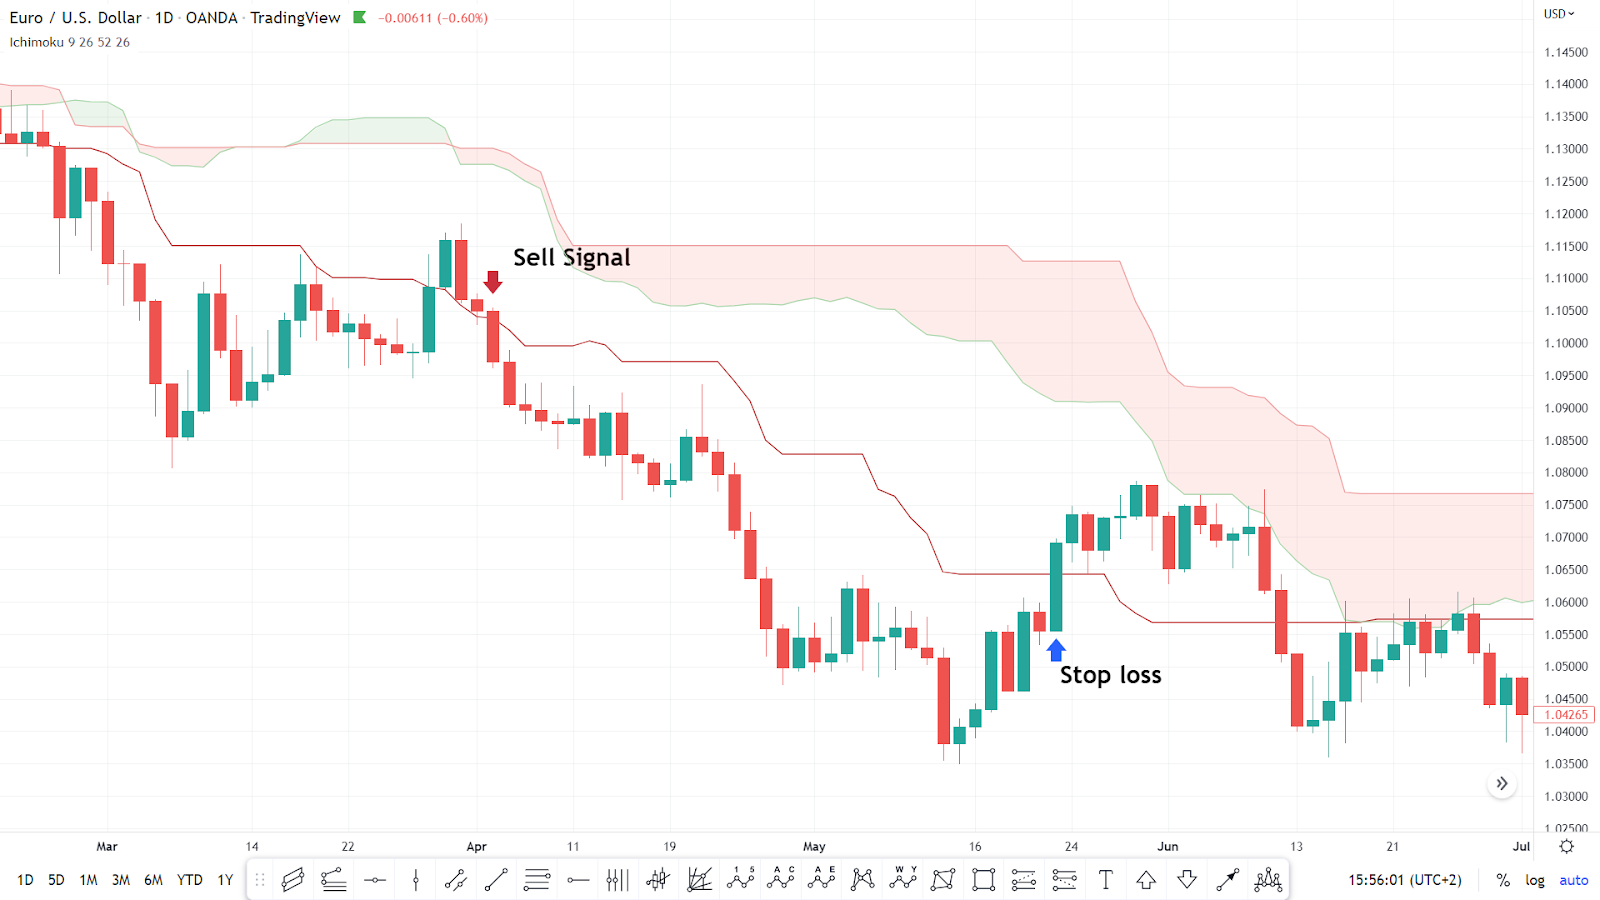
Figure 6
Price, cloud, and chikou span strategy
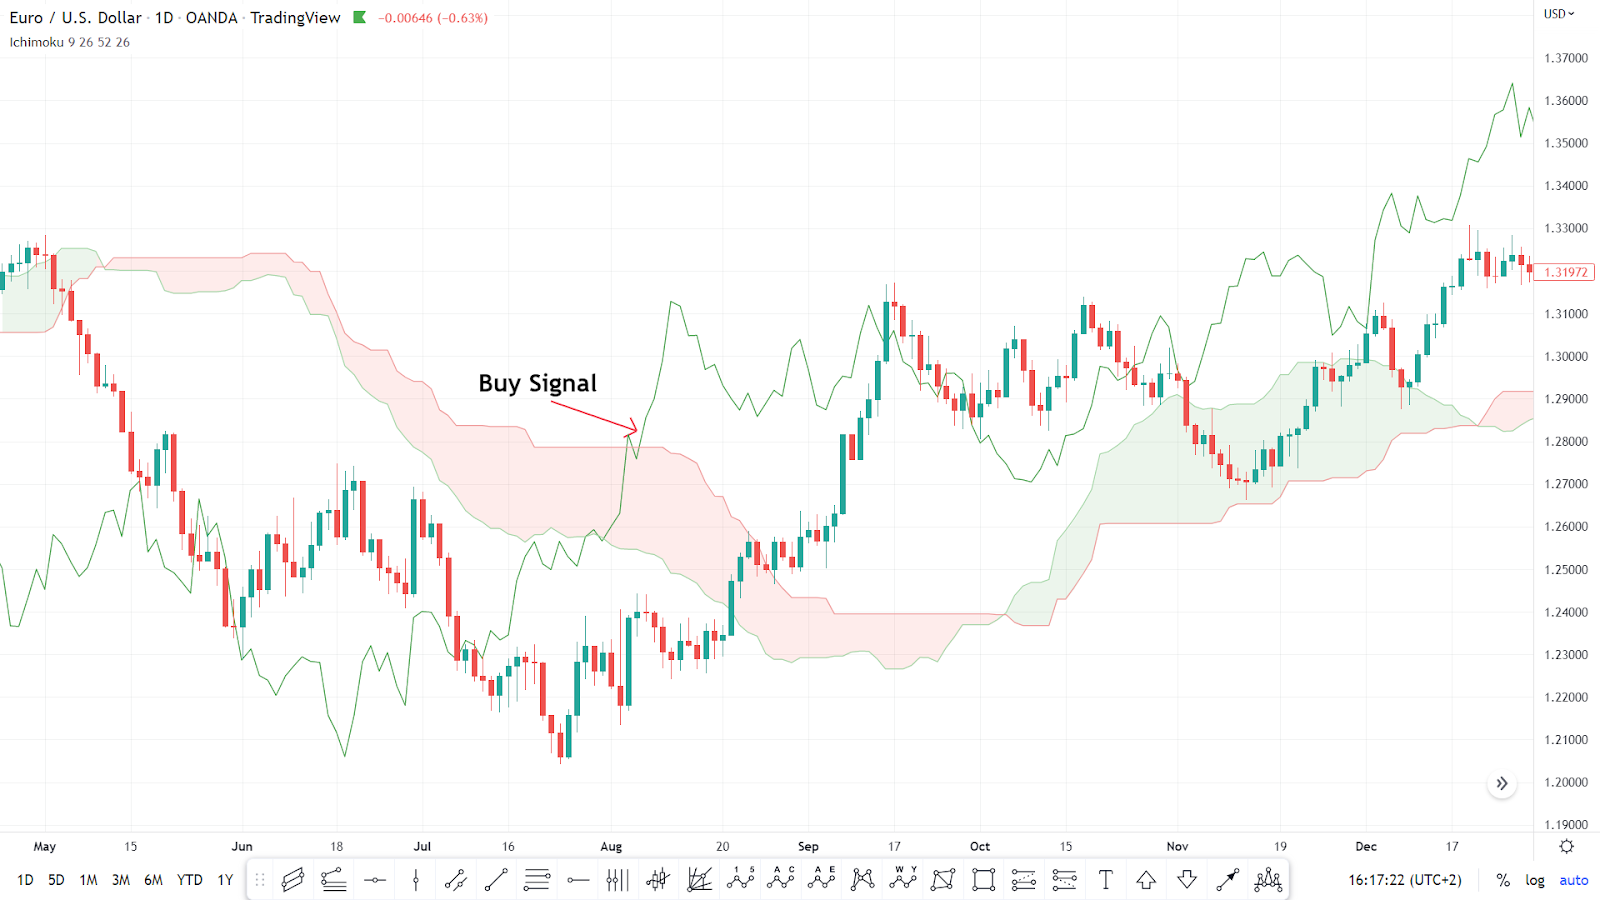
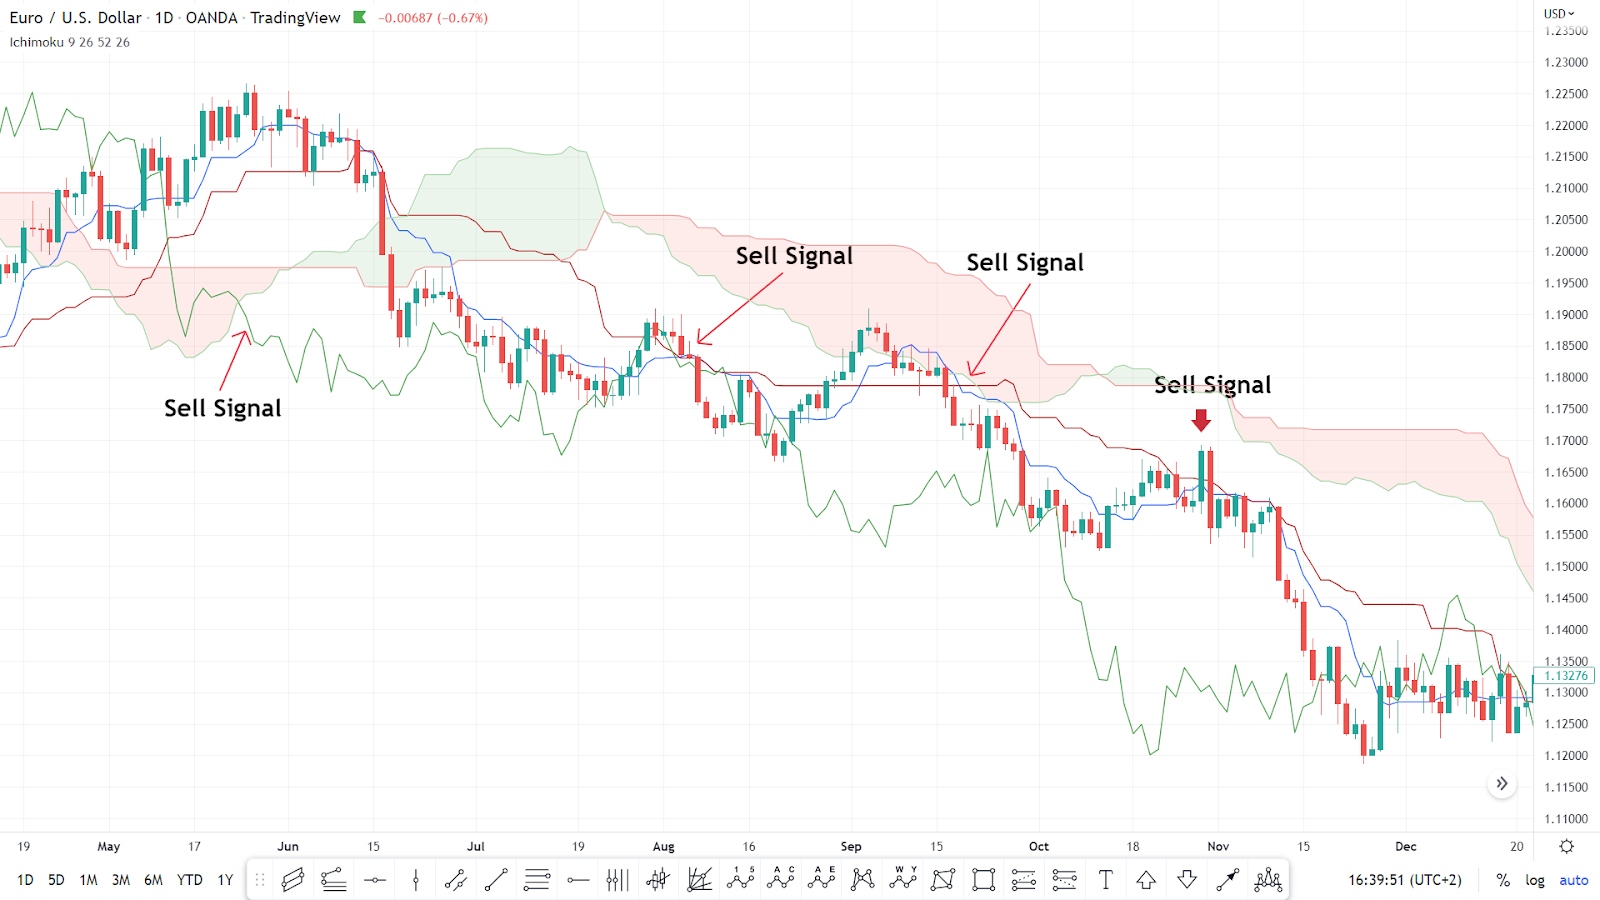
Here’s the setup and signals for the price, cloud, and chikou strategies, seen in Figures 7 and 8.
- Setup: Price > Cloud Signal: Chikou Span > Cloud
- Stop loss: the lower boundary of the Cloud
- Setup: Price < Cloud Signal: Chikou Span < Cloud
- Stop loss: the upper boundary of the Cloud
Figure 7
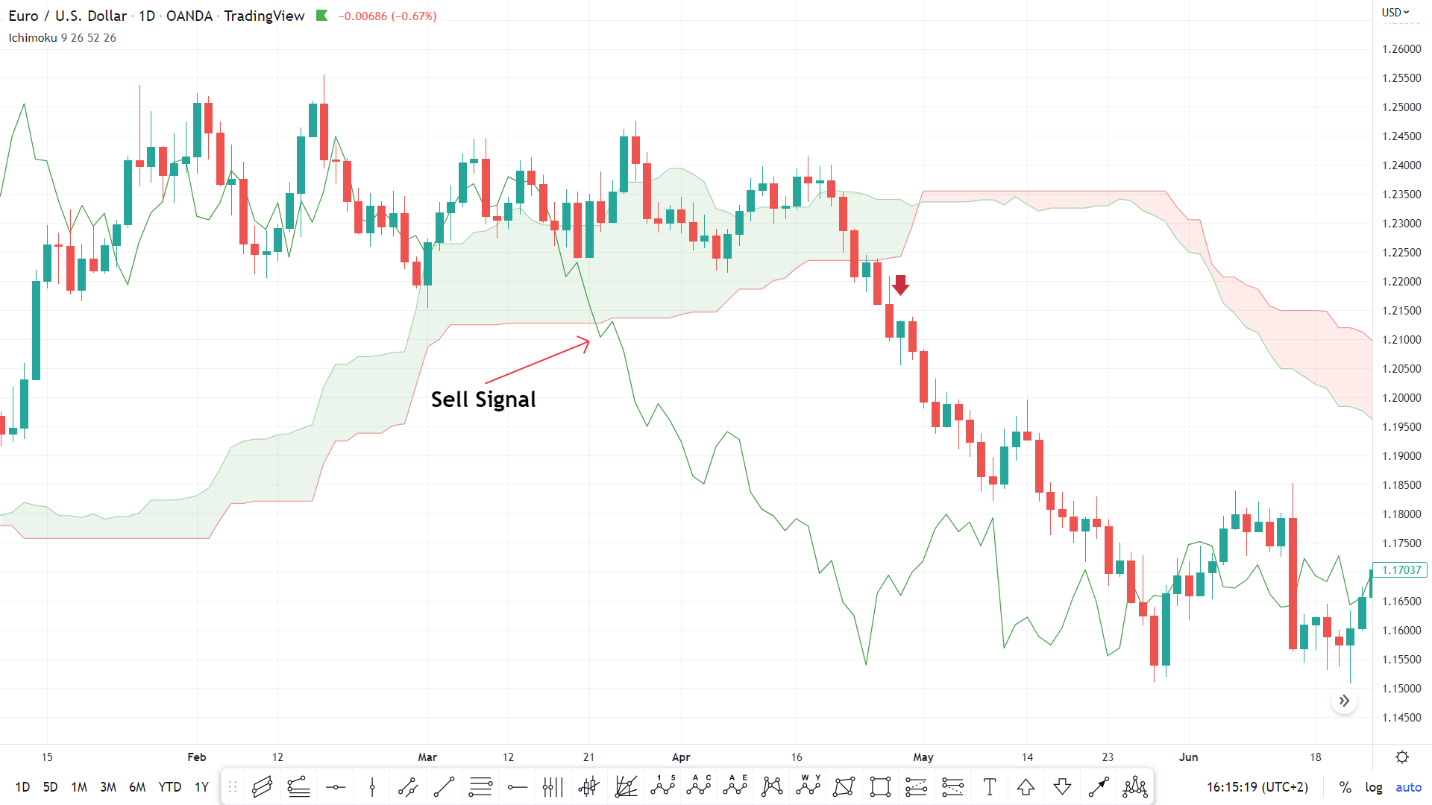
Figure 8
Ichimoku full system
Here’s the Ichimoku full system strategy, shown in Figures 9 and 10.
Figure 9
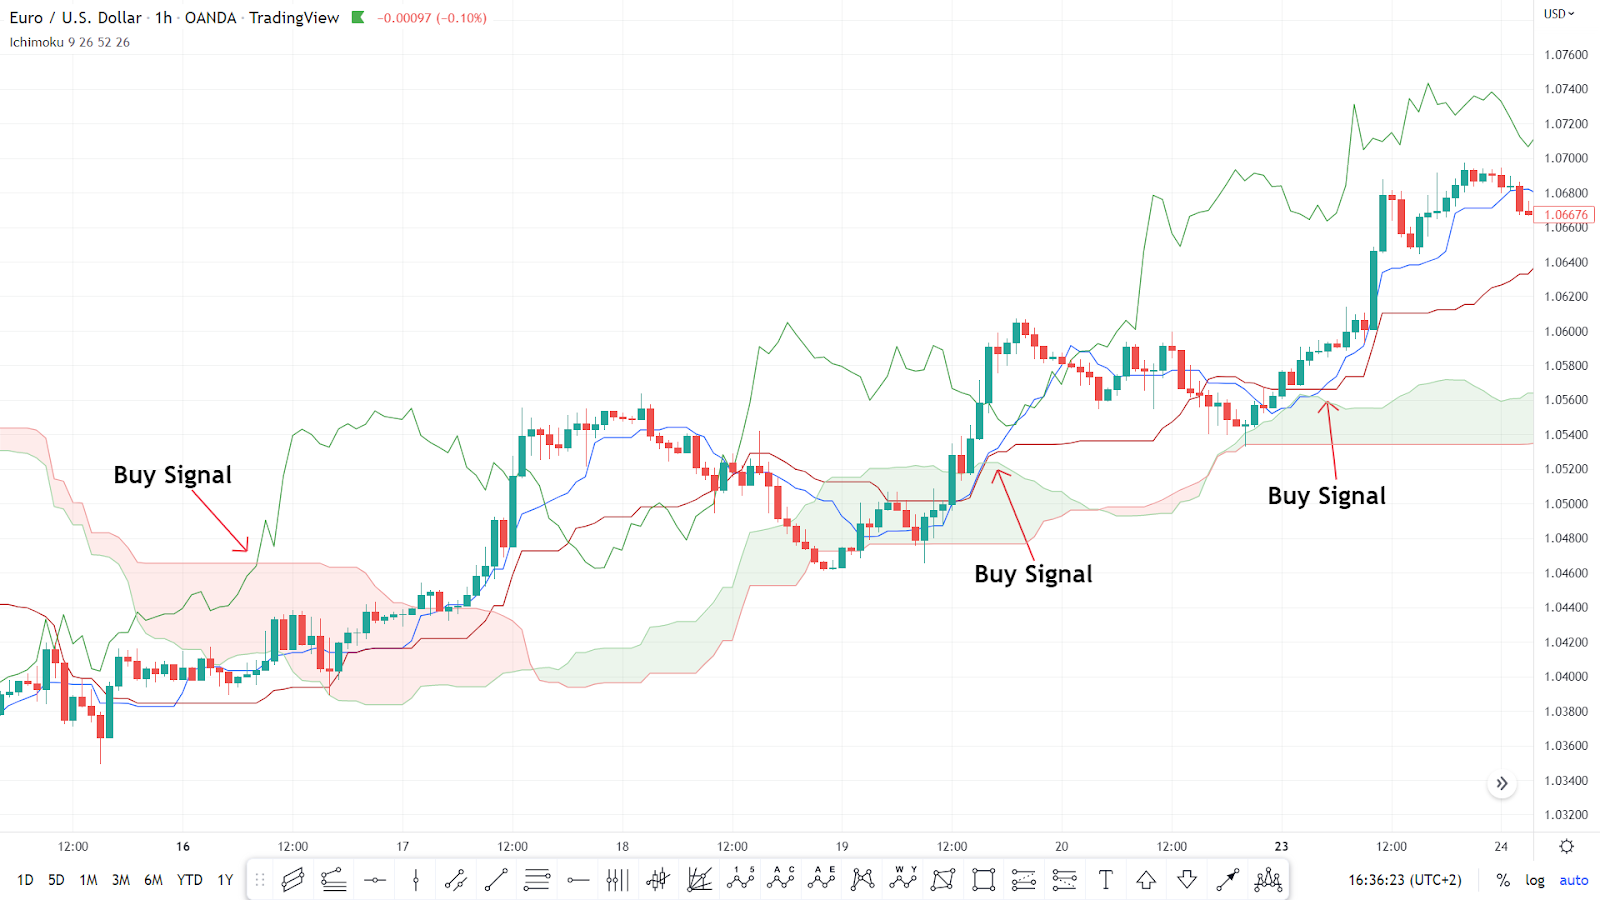
Figure 10
Disclaimer: The content published above has been prepared by CFI for informational purposes only and should not be considered as investment advice. Any view expressed does not constitute a personal recommendation or solicitation to buy or sell. The information provided does not have regard to the specific investment objectives, financial situation, and needs of any specific person who may receive it, and is not held out as independent investment research and may have been acted upon by persons connected with CFI. Market data is derived from independent sources believed to be reliable, however, CFI makes no guarantee of its accuracy or completeness, and accepts no responsibility for any consequence of its use by recipients.


