
- Specials
 AccountsTrading DetailsCFI AIHelp & SupportPartnership
How to trade with moving averages

- Introduction
Moving Averages are some of the oldest technical indicators used by traders. These indicators were originally drawn by hand before computers were used in technical analysis. Moving averages offer many benefits for traders and holds a number of trading applications.
- What is a Moving Average?
A moving average is a mathematical calculation used to smooth out the short-term noise or short-term volatility in price movement. It is a lagging indicator, which means moving averages never anticipates price movement. It only tells us that prices have moved upward or downward.
- What are the types of Moving Averages?
There are many types of moving averages, with each one stemming from the different ways of calculating the average to make it more sensitive to price action.
Types of Moving Averages:
- Simple Moving Average (SMA)
SMA = (Sum (Price, n)) / n
Where: n = Time Period
- Linear Weighted Moving Average (LWMA)
LWMA= (Pn∗W1) +(Pn−1∗W2) +(Pn−2∗W3) / ∑W
- Exponential Moving Average (EMA)
EMA = Closing price x multiplier + EMA (previous day) x (1-multiplier)
- Smoothed Moving Average (SMMA)
SMMAi = (Sum - SMMAi-1) / N
where:
SMMAi - is the value of the period being calculated.
Sum - is the sum of the source prices of all the periods over which the indicator is calculated.
There are many more types of moving averages, however these are the most commonly applied ones in trading. All these calculation types try to decrease moving average lagging time and increase its response to price movements. All moving average types are used the same way. Figure 1 presents the different types of moving averages.
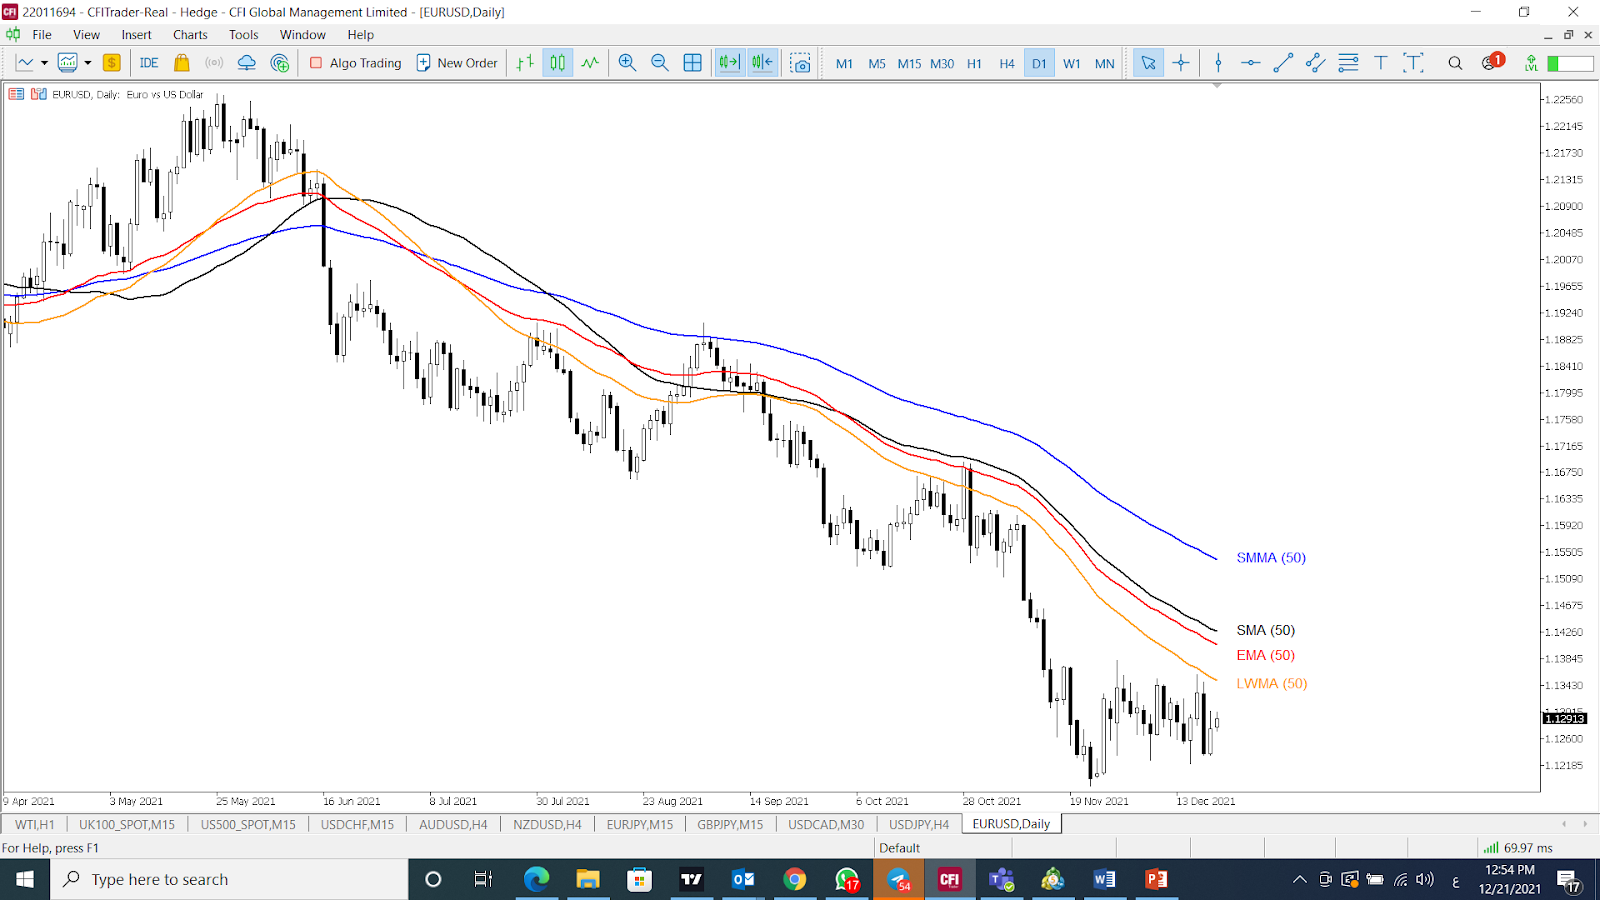
Figure 1: EURUSD with SSMA (50), SMA (50), EMA (50), LWMA (50), Source: MT5
- How to use Moving Averages in trading?
Moving averages offer many trading applications. The most useful ones being that they define price trends, generating trading signals and creating points as support or resistance.
- Using Moving Averages understand price trends
- Using One moving Average
When prices move above the moving average, this means that prices are better than their average, indicating that buyers are in control. When prices move below its moving average, this signals that sellers are now in control. This is shown clearly in Figure 2.
When seeing an upward sloping moving average, this makes it clear that the current trend is heading upwards. Likewise, when the slope of the moving average is moving downward, this signifies that the current price trend is negative (Figure 2).
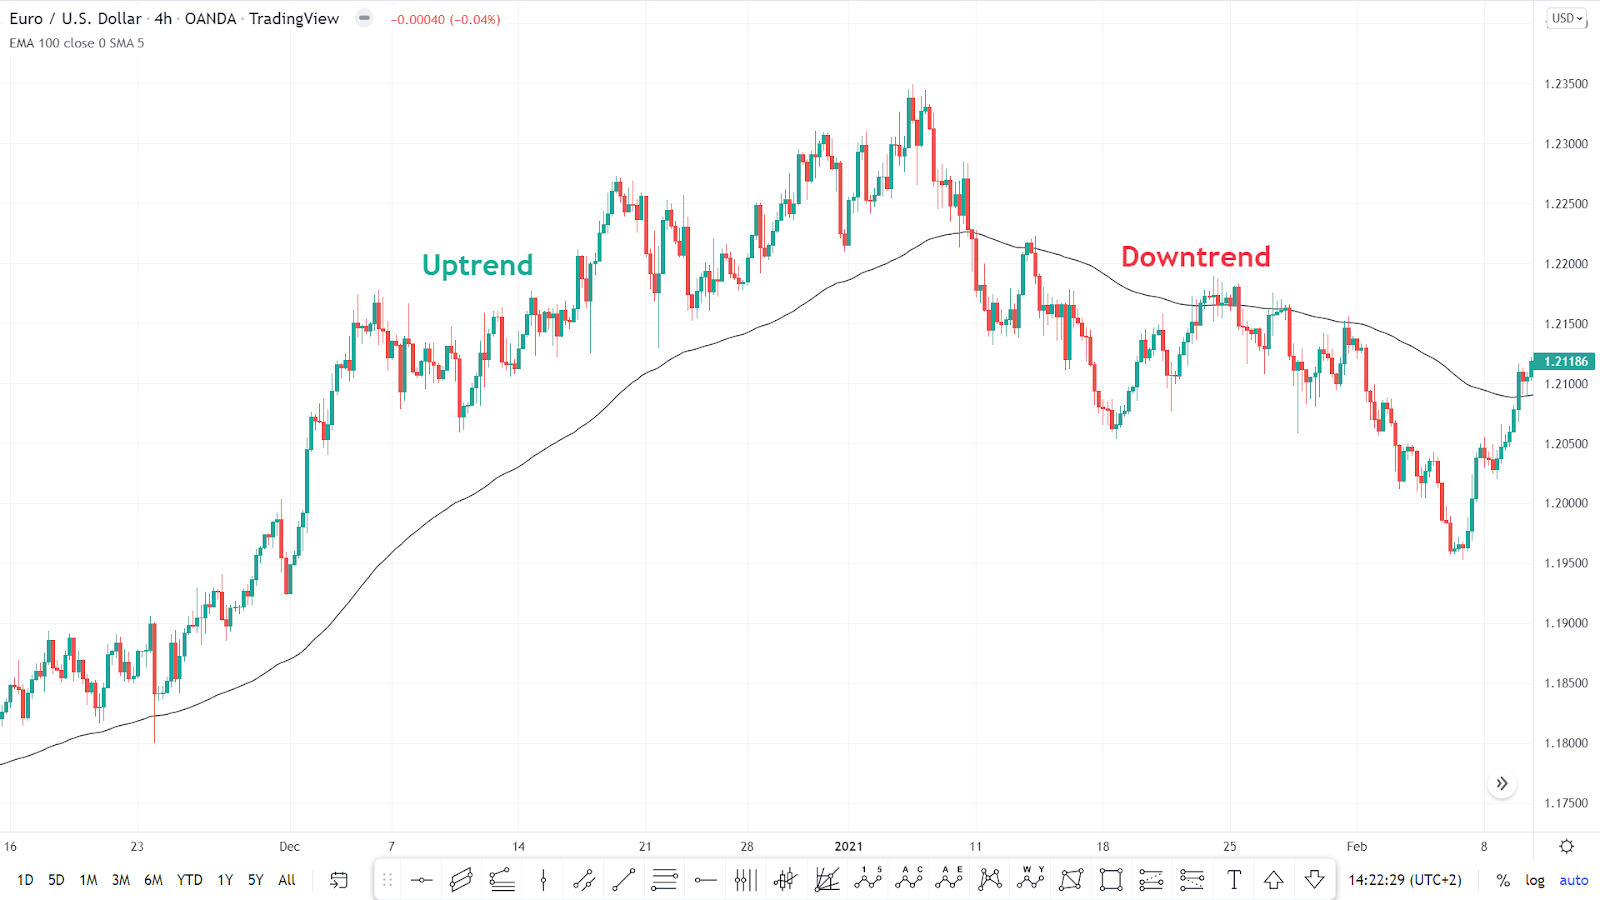
Figure 2: EURUSD price with EMA, Source: MT5
- Using Two Moving Averages
Using two moving averages is very useful for traders to see different price cycles in the same chart. When the faster moving average is moving above, the longer moving average prices moves in an uptrend. When the faster-moving average is moving below the slower one, the prices move in a downtrend, as shown in Figure 3
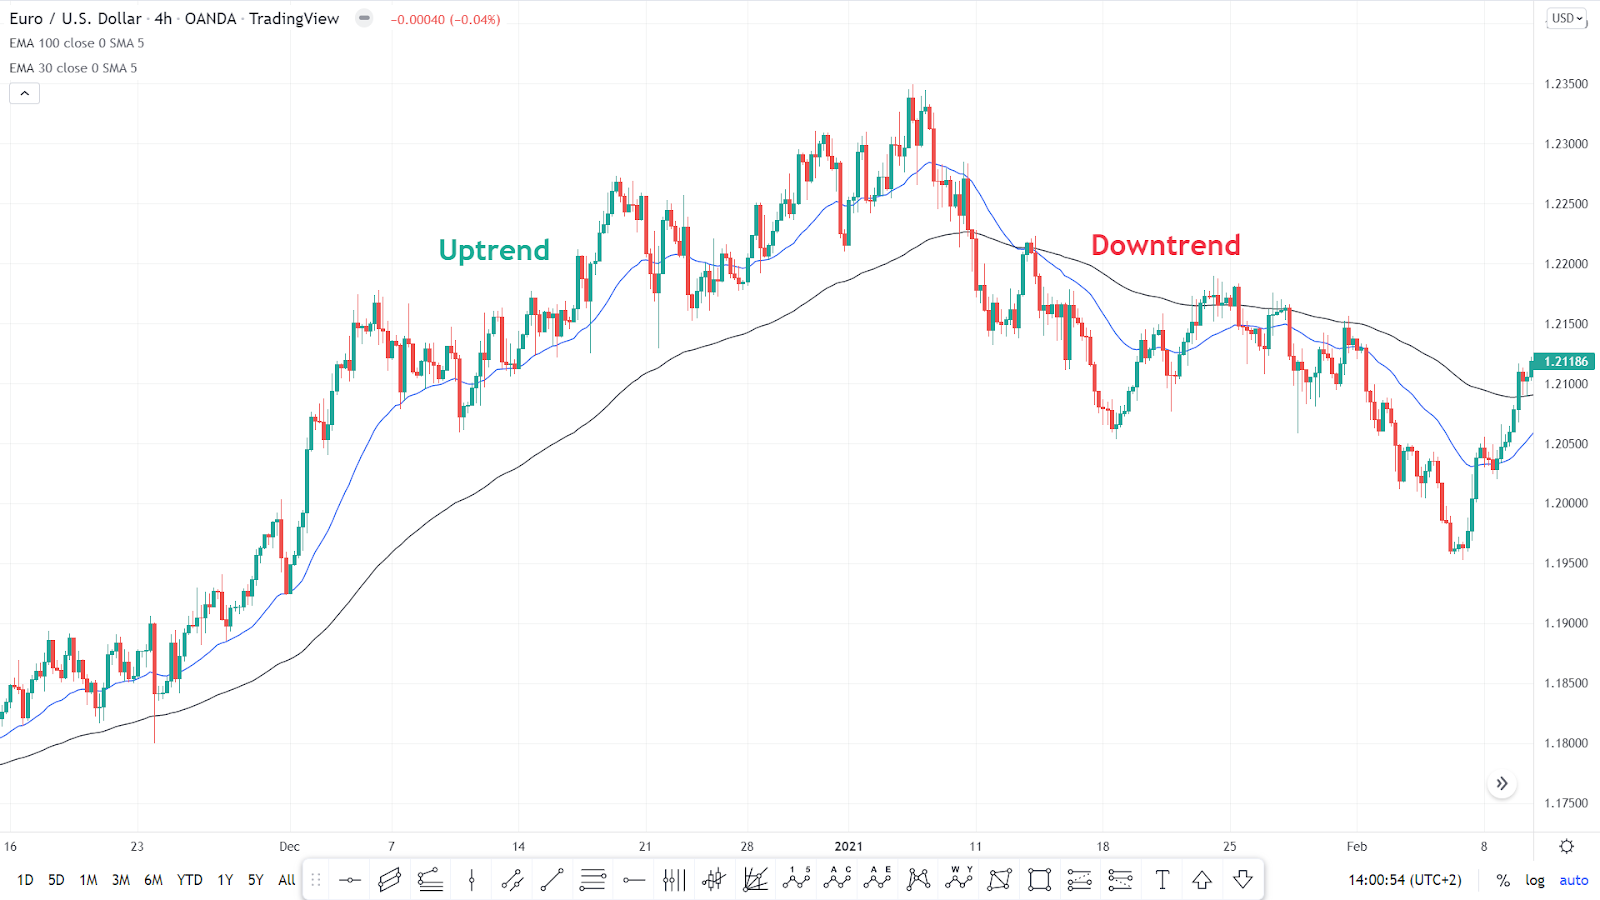
Figure 3: EURUSD Price with two moving averages, Source: MT5
- Moving Averages as support and resistance
When prices move above the moving average, it usually acts as dynamic support, and when prices move below the moving average, this usually acts as dynamic resistance, as shown in Figure 4 below.
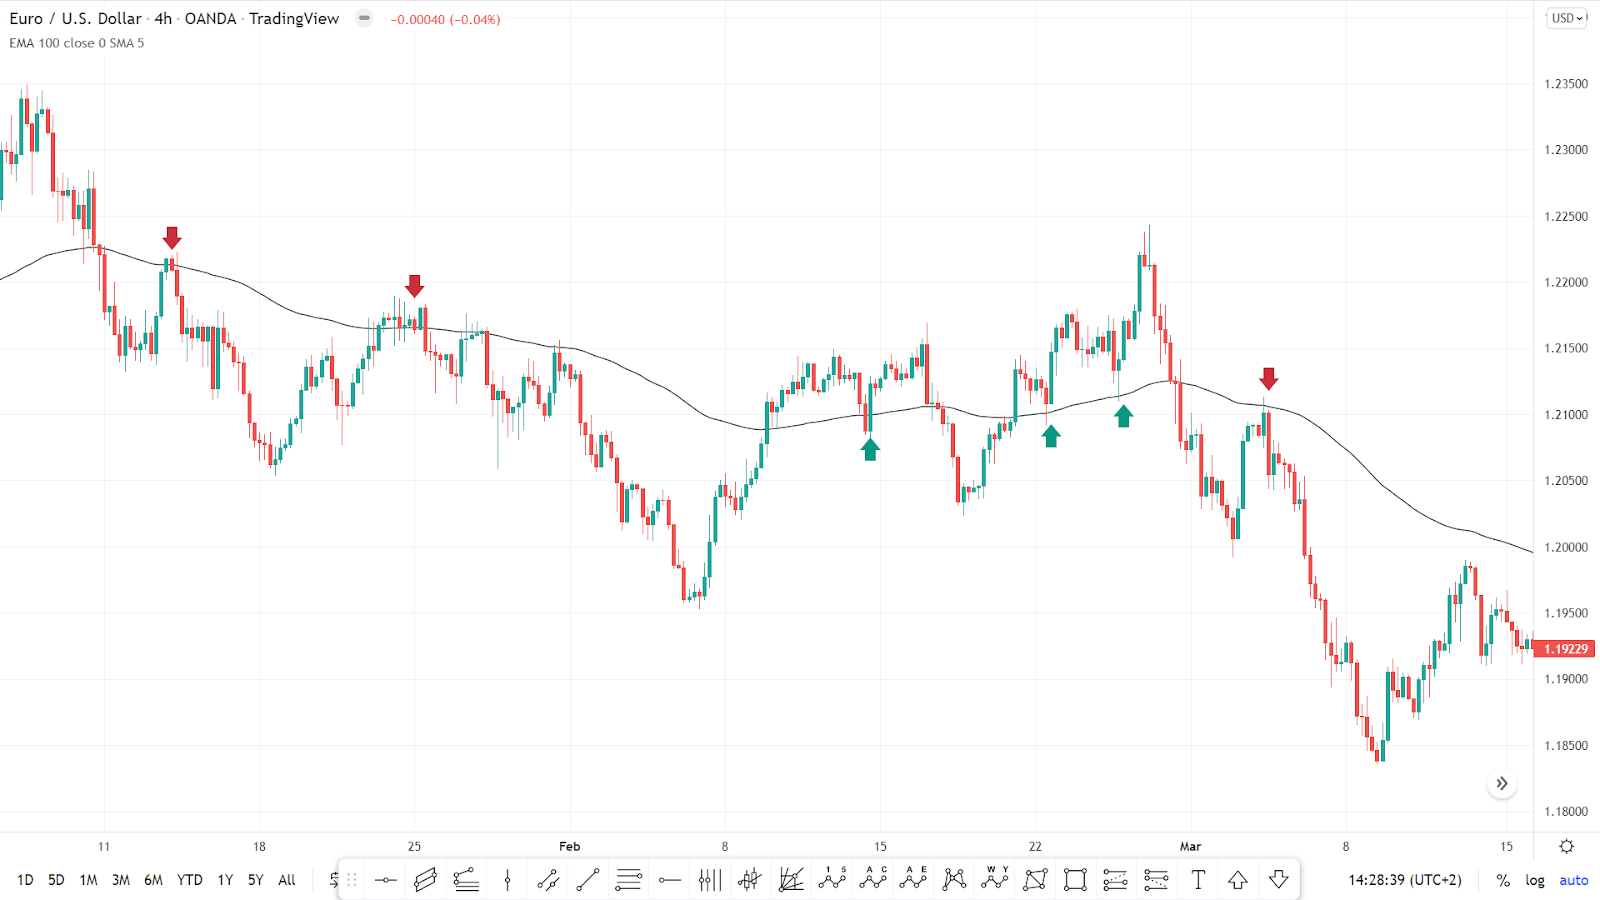
Figure 4: EURUSD price with EMA, Source: MT5
- Using Moving averages as trading signals
- One Moving Average
The cross over between the price and moving average. Buy Signal is triggered when prices cross above the moving average.
A sell signal is triggered when prices cross below the moving average, as shown in Figure 5.
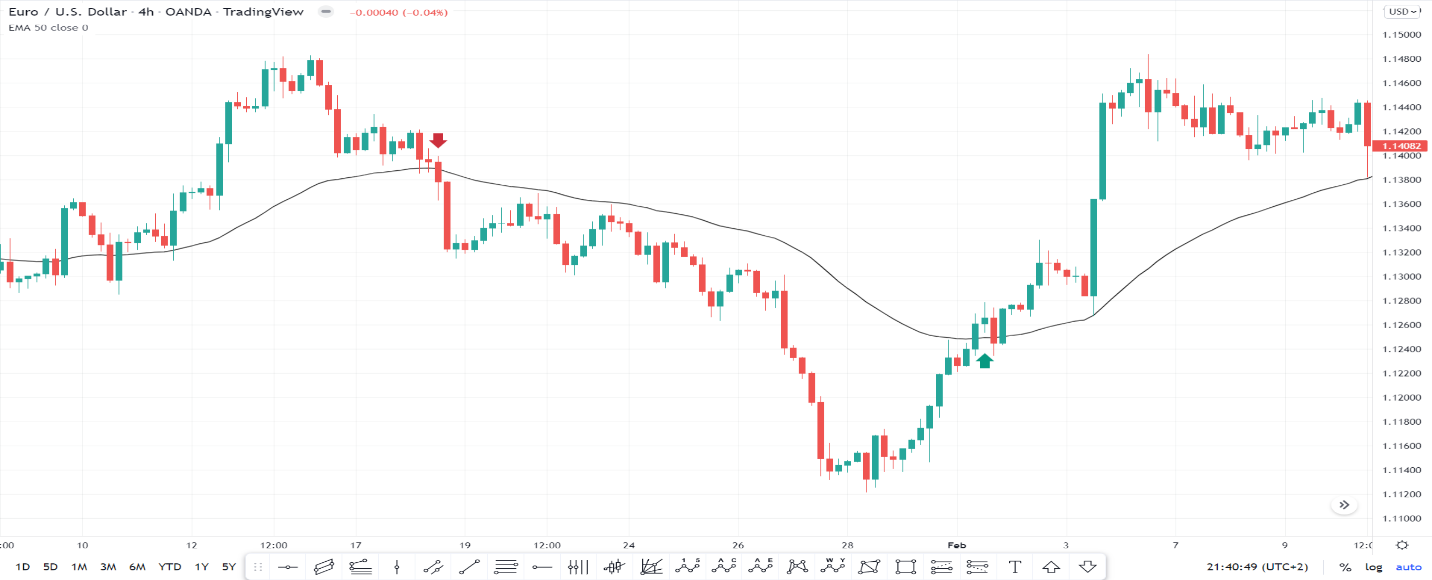
Figure 5: Buy and sell signals, Source: MT5
The cross over occurs when two candles close above or below the moving average for more confirmation. The disadvantage of this way of signals is that there will be many whipsaws or false signals.
When looking at the slope of the moving average, an upward moving slope can indicate a buy signal, while a downward sloping average can indicate a sell signal, as shown in Figure 6.
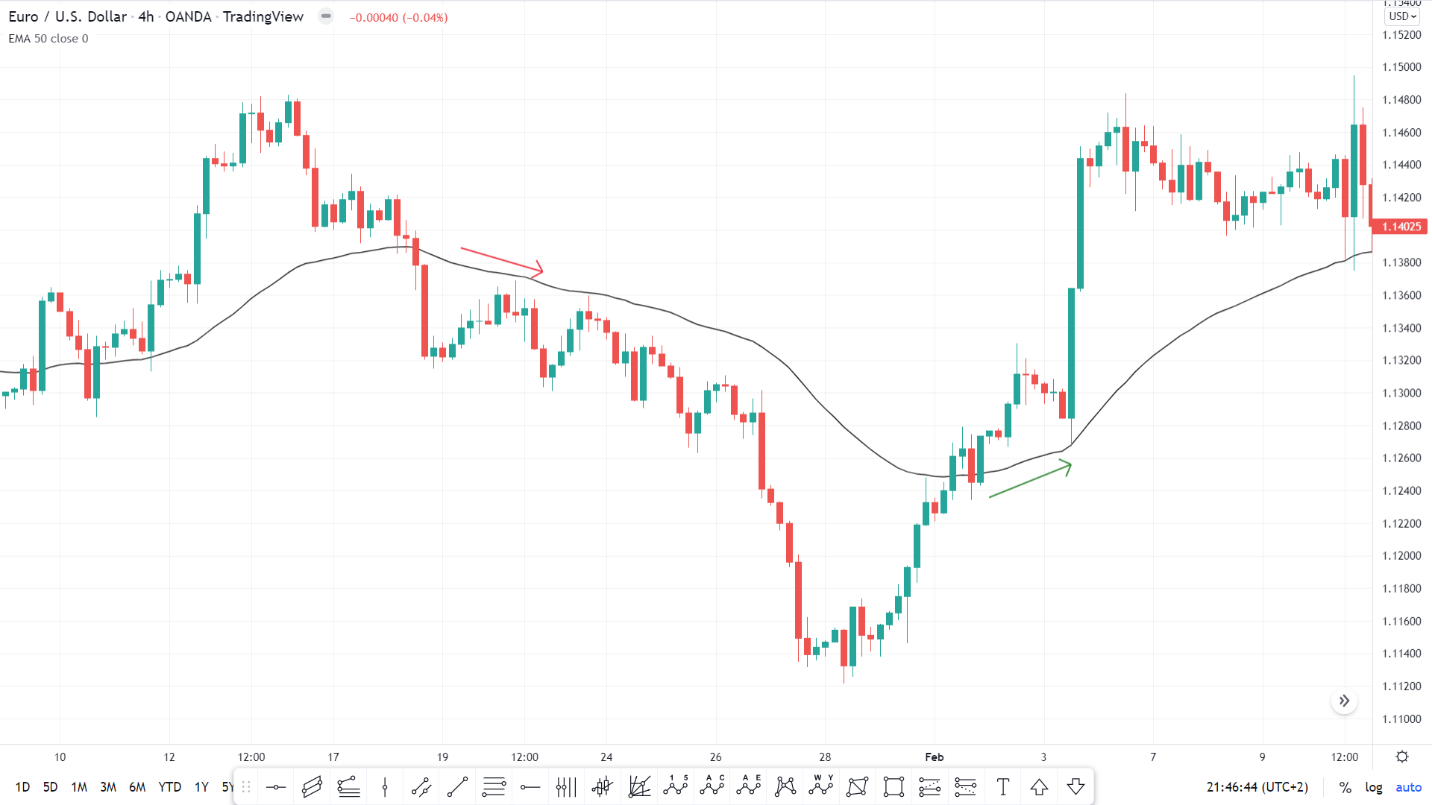
Figure 6: Buy and sell signals, Source: MT5
- Two moving averages
With 2 moving averages, we can use a slower moving average to determine the long-term market trend and the faster-moving average to time the market entry.
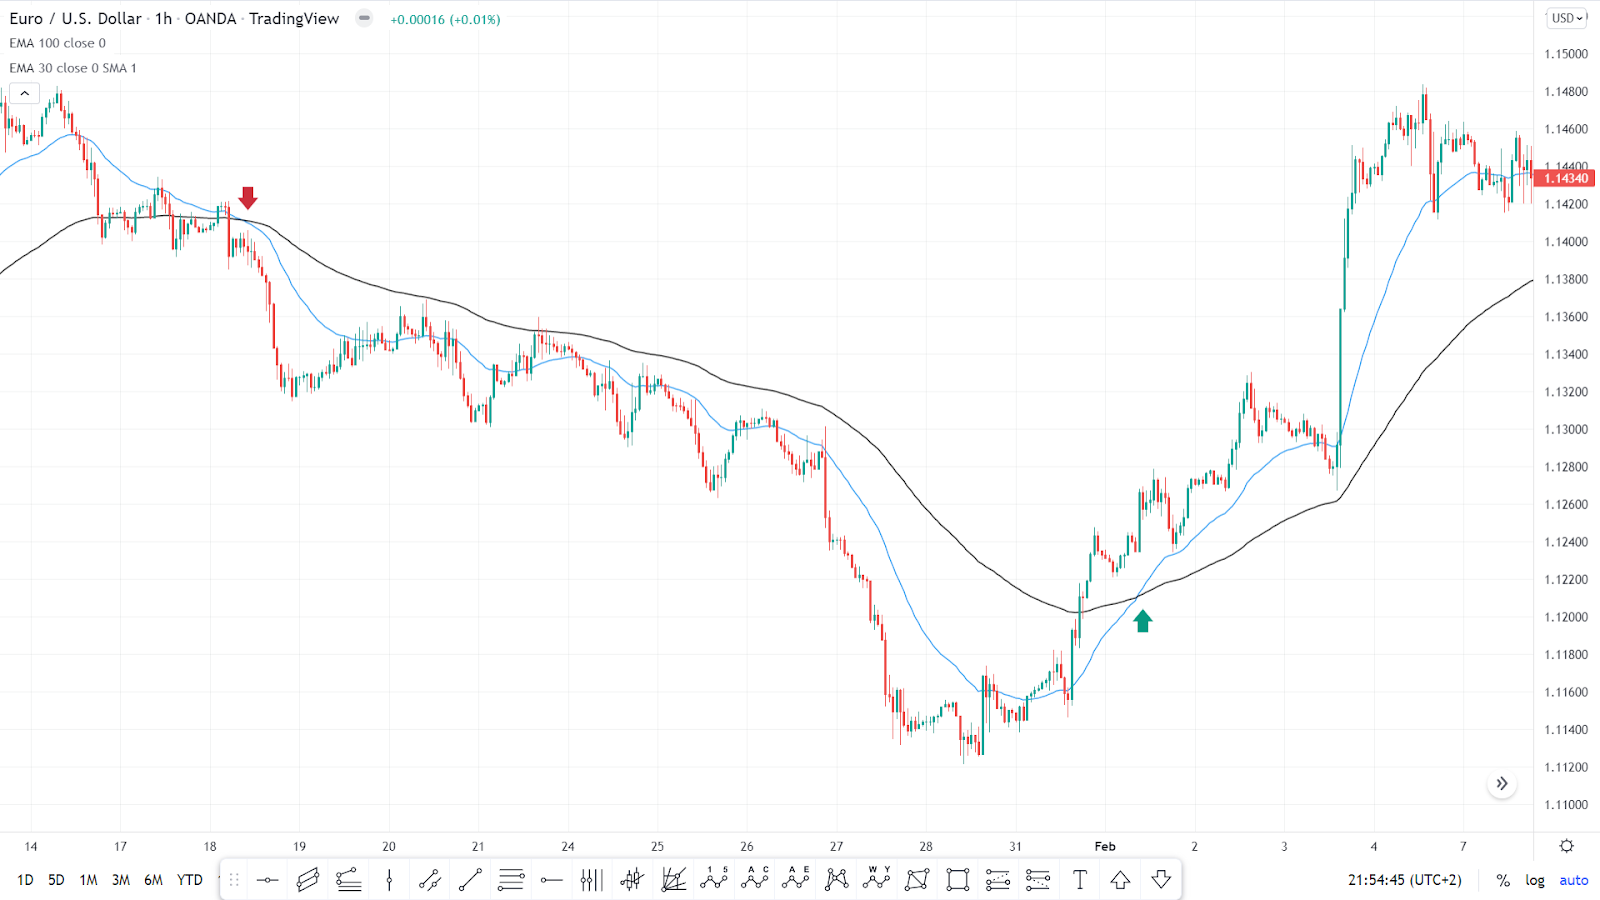
A buy signal is triggered when the faster average crosses above the slower average, while a sell signal is triggered when the faster average crosses below the slower one, as shown in Figure 7.
Figure 7: Crossover of 2 moving averages, Source: MT5
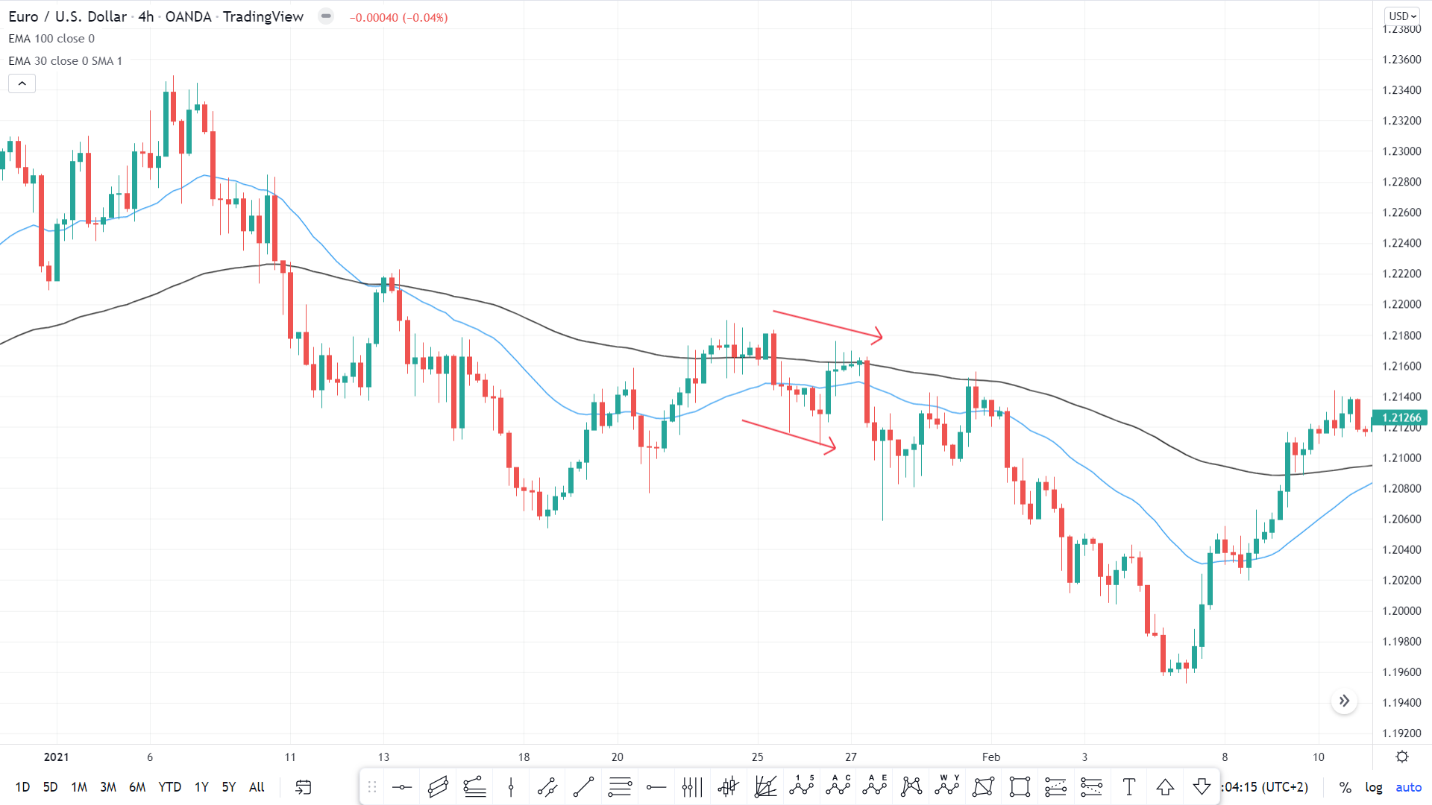
Looking at the slope, a buy signal is triggered when the slope of the faster-moving average moves positive in tandem with the slower moving average, as shown in Figure 8.
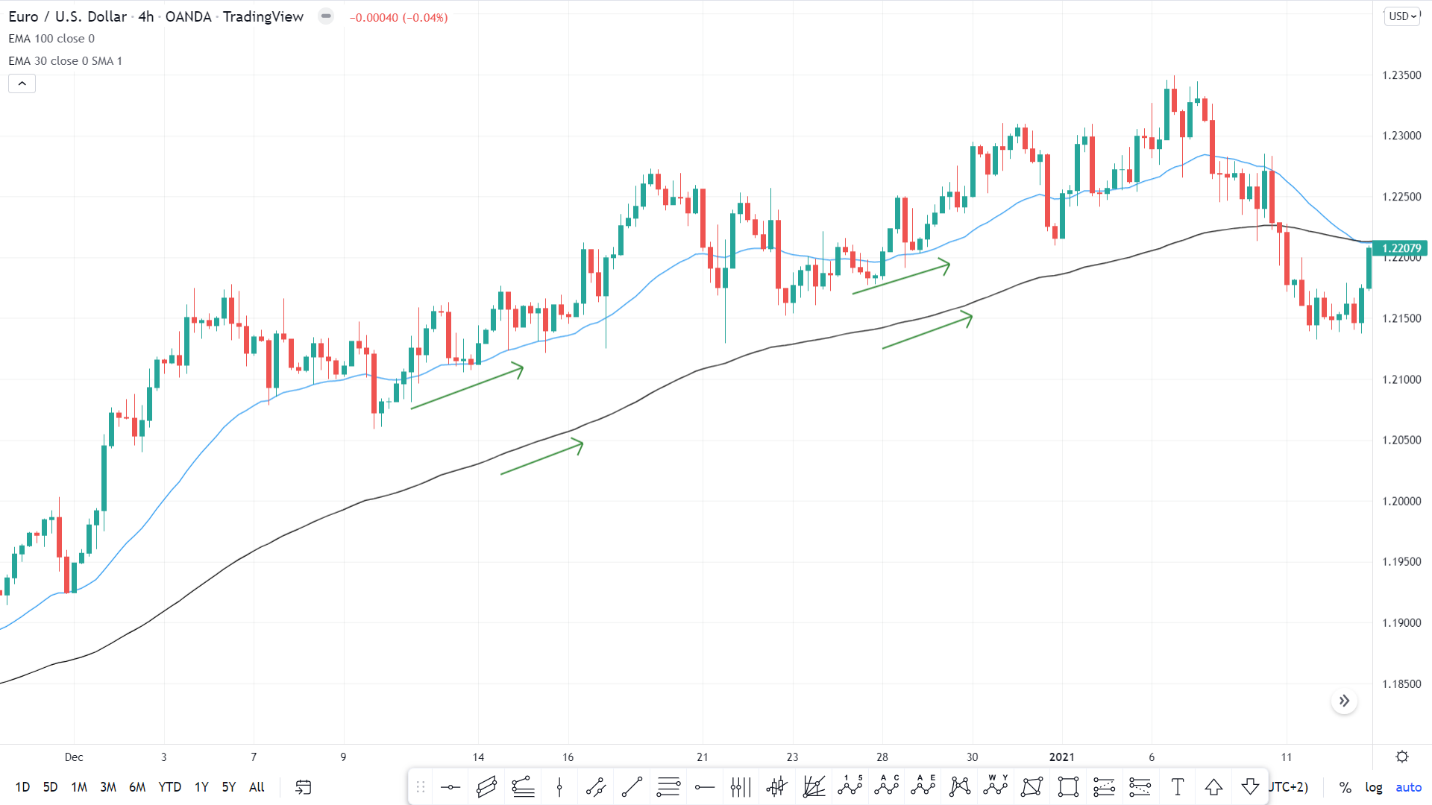
Figure 8: 2 Upward sloping moving averages, Source: MT5
At the same time, a sell signal is triggered as the slope of the faster-moving average moves negative along with the slower moving average is downward, as shown in Figure 9.
Figure 9: 2 downward sloping moving averages, Source: MT5
- Three Moving Averages
Three moving averages can be used to show three trend cycles, including the long-term moving average for the long-term cycle, the medium-term average for the medium-term cycle, and the medium-term moving average for the short-term cycle.
A buy signal is triggered when the short-term MA cross above the medium term one, however the medium-term MA must be above the long-term MA, as shown in Figure 10.
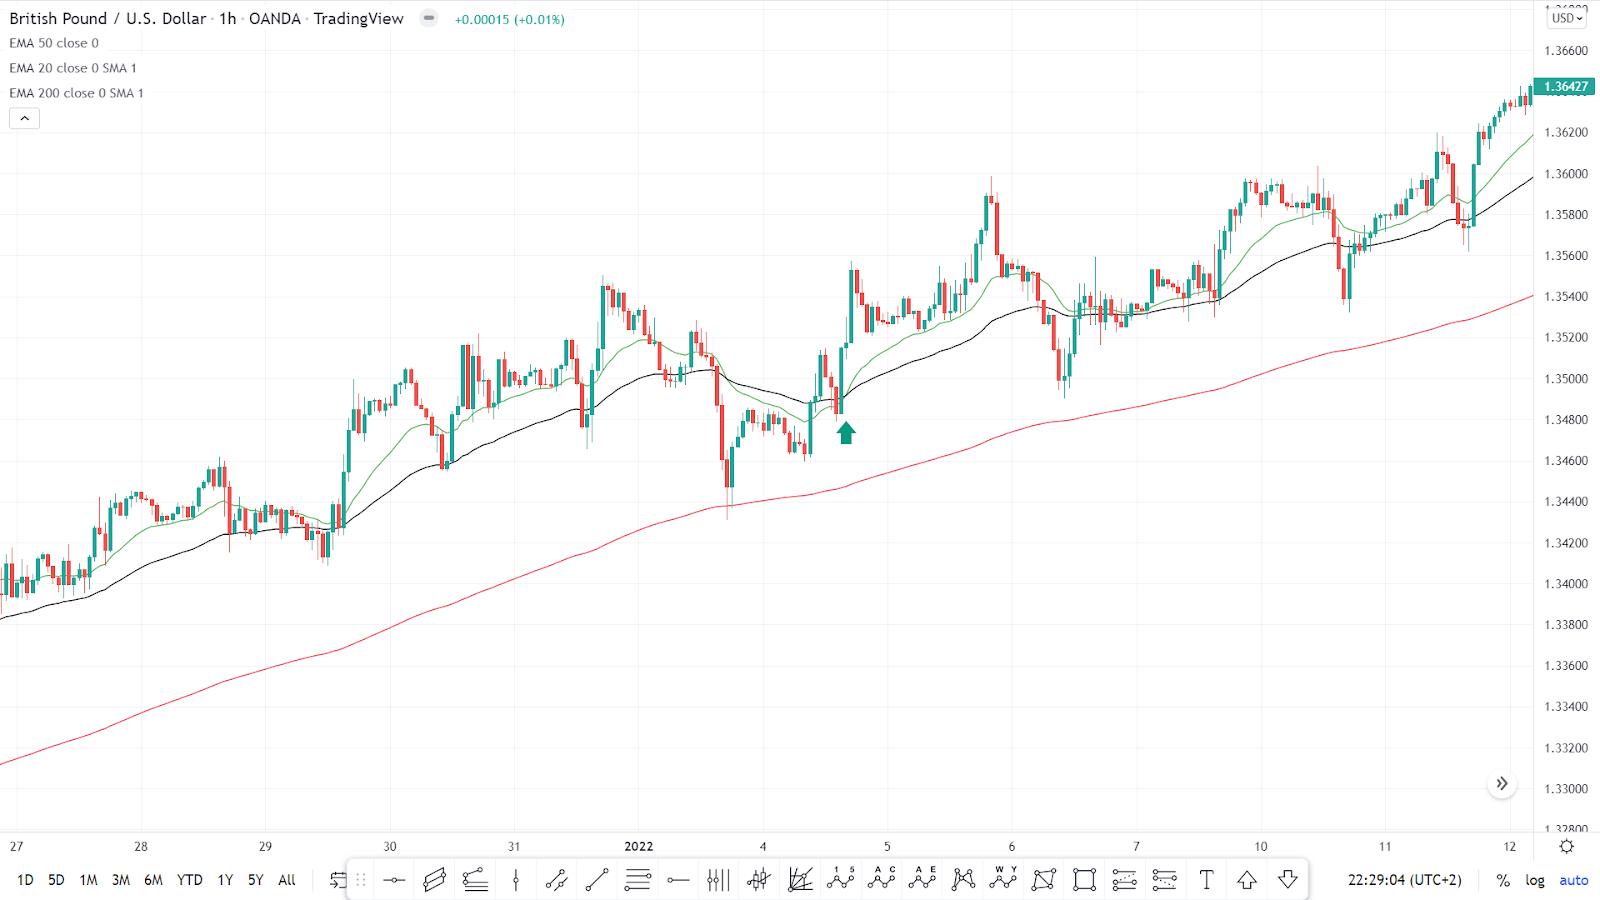
Figure 10: 3 moving averages buy signal, Source: MT5
Sell signals arise when the short-term MA cross below the medium term one, while the medium-term MA remains be below the long-term MA, as shown in Figure 11.
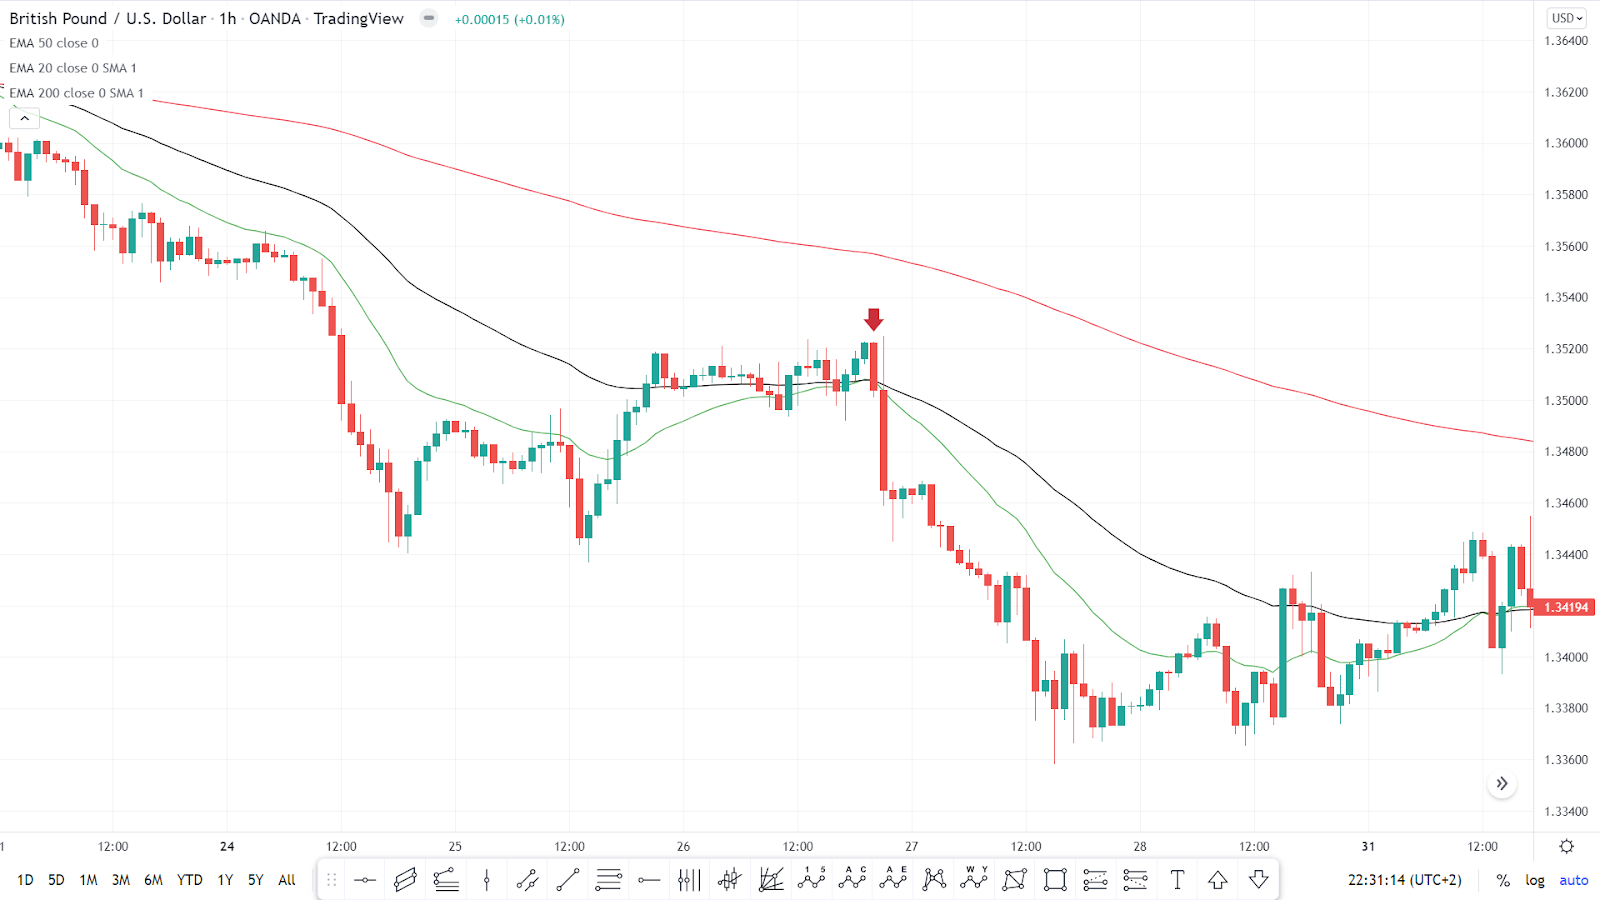
Figure 11: 3 moving averages sell signal, Source: MT5
- When should I close a current position?
We have discussed how to use one, two, and three moving averages to enter a position, but when should we close those positions? Traders can exit a position when an opposite signal occurs or by using an exit strategy such as a fixed target or any trailing stop methods.
- When I should avoid using Moving Averages?
Moving average is a trending indicator that means it should use when prices move in a clear direction. You should avoid any trading signals in a sideways market and wait until that sideways end and a new trend begins, either upward or downward. as shown in figure (12), there are many false signals during a sideways market
.
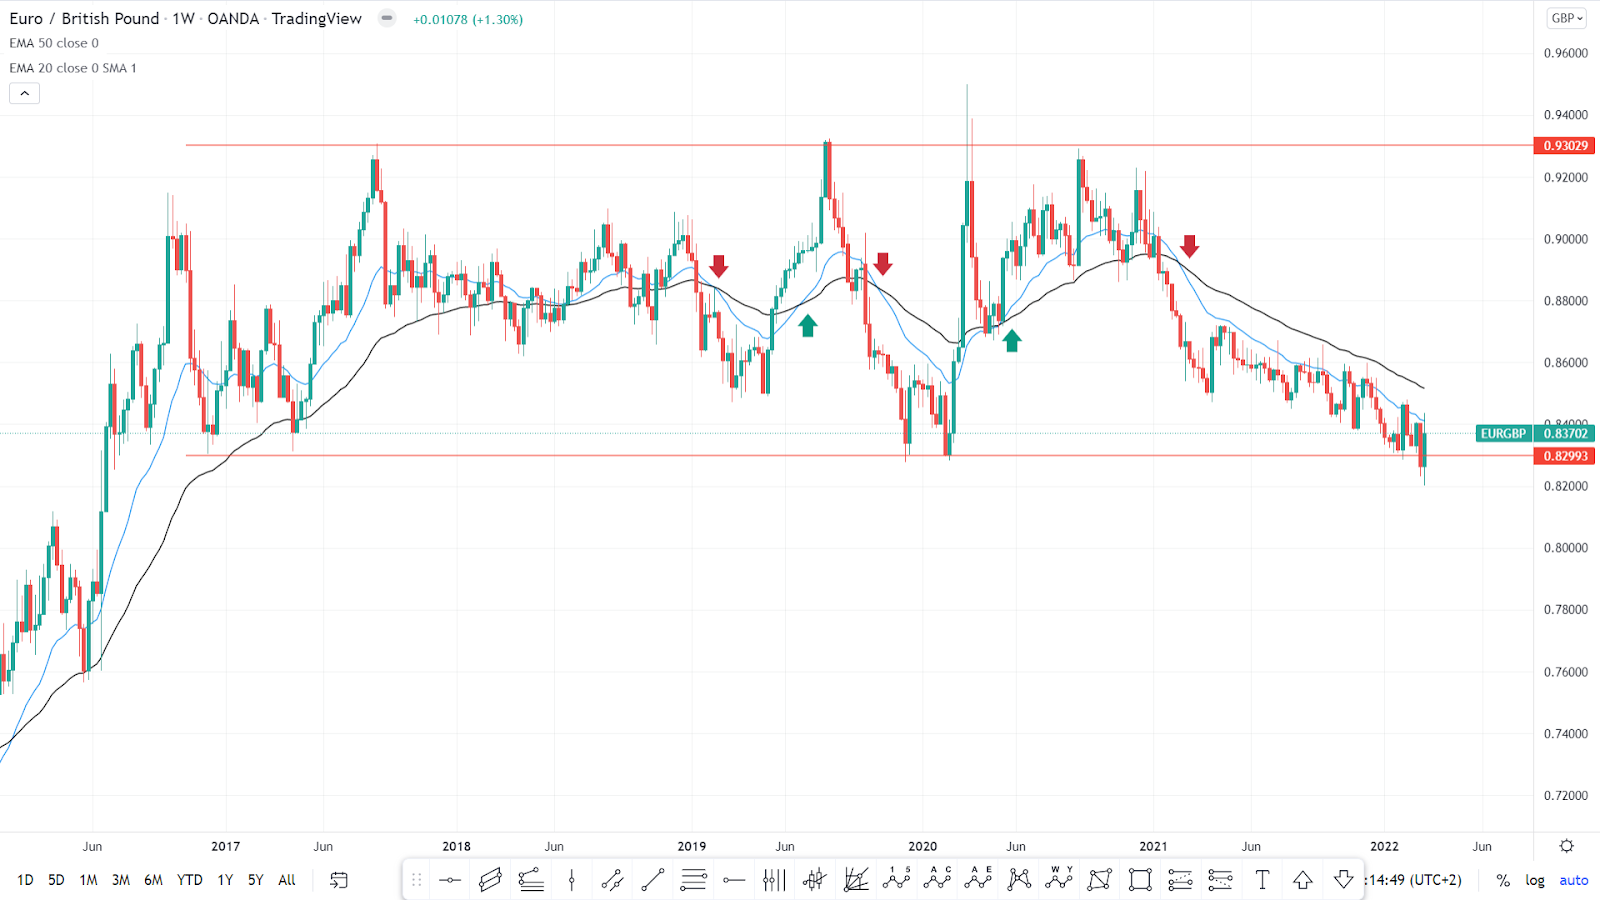
figure (12)
- Problems with Moving Averages
Moving averages can be a profitable trading system, however this strategy alone has a low winning probability ratio of less than 50%.
- Conclusion
Moving Averages are some of the oldest trading indicators used by traders, calculated easily even without computers. As shown, this broad indicator offers many trading applications holds valuable uses for every type of trader.
Disclaimer: The content published above has been prepared by CFI for informational purposes only and should not be considered as investment advice. Any view expressed does not constitute a personal recommendation or solicitation to buy or sell. The information provided does not have regard to the specific investment objectives, financial situation, and needs of any specific person who may receive it, and is not held out as independent investment research and may have been acted upon by persons connected with CFI. Market data is derived from independent sources believed to be reliable, however, CFI makes no guarantee of its accuracy or completeness, and accepts no responsibility for any consequence of its use by recipients.


