
- Accounts
 Trading DetailsCFI AIHelp & SupportPartnership
Long-Term Trading

Suppose you want to become a successful trader in financial markets. In that case, you must choose a way of trading that suits your way of life. Some traders prefer to constantly monitor the market and trade with higher frequency. Meanwhile, others prefer long-term trading, or to trade just once or twice per day.
Scalping
Scalping is a very rapid trading style. Scalpers often make trades within just a few seconds. That means they may go long one minute but short the next, often taking advantage of small price movements using high leverage.
Scalping best suits active traders who can make instant decisions and act on them without hesitation. Impatient people often make the best scalpers. They will exit the trade quickly if it goes against them.
Day trading
Day trading suits traders who prefer to start and complete a task on the same day. Day trading is a style that specifies a trader will open and close all their positions before the markets close. Day traders will buy and sell multiple assets within the trading day, or sometimes multiple times a day, to take advantage of short-term market movements.
Swing trading
Swing Traders are considered medium-term as positions are generally held between a few hours and a few days. swing trading is the process of identifying where an asset's price is likely to move next, entering a position, and capturing a chunk of the profit if that move materializes.
Position trading
Position trading is the longest-term trading of all. It often involves trades that last for several years. Thus, position trading only suits the most patient traders. Its targets are often several thousand pips.
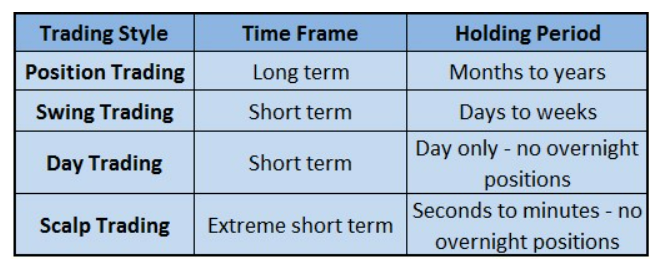
Investing is perhaps the most recognized form of position trading. However, an investor would deploy a “buy and hold” strategy, whereas position trading can also refer to short positions. Large capital is required to withstand any potential volatility during the lifetime of the trade and avoid a margin call. Position traders usually use a combination of technical and fundamental analysis when making decisions, but also consider other factors such as market trends and historical patterns. Figure 1 shows a comparison of the forms of trading and their respective holding periods.
Figure 1
Positional trading strategies
There are two key positional trading strategies:
1. Breakout trading strategy
The basic concept underlying breakout systems is straightforward: the ability of a market to move to a new high or low indicates the potential for a continued trend in the direction of the breakout. Here’s how it works:
- Cover short and go long if today’s close exceeds the prior N -day high.
- Cover long and go short if today’s close is below the prior N -day low.
The value chosen for N will define the sensitivity of the system. If a short-duration period is used for comparison to the current price (e.g., N = 7), the system will indicate trend reversals quickly, but will also generate many false signals. in contrast, the choice of a longer-duration period (e.g., N = 40) will reduce false signals, but at the cost of slower entry.
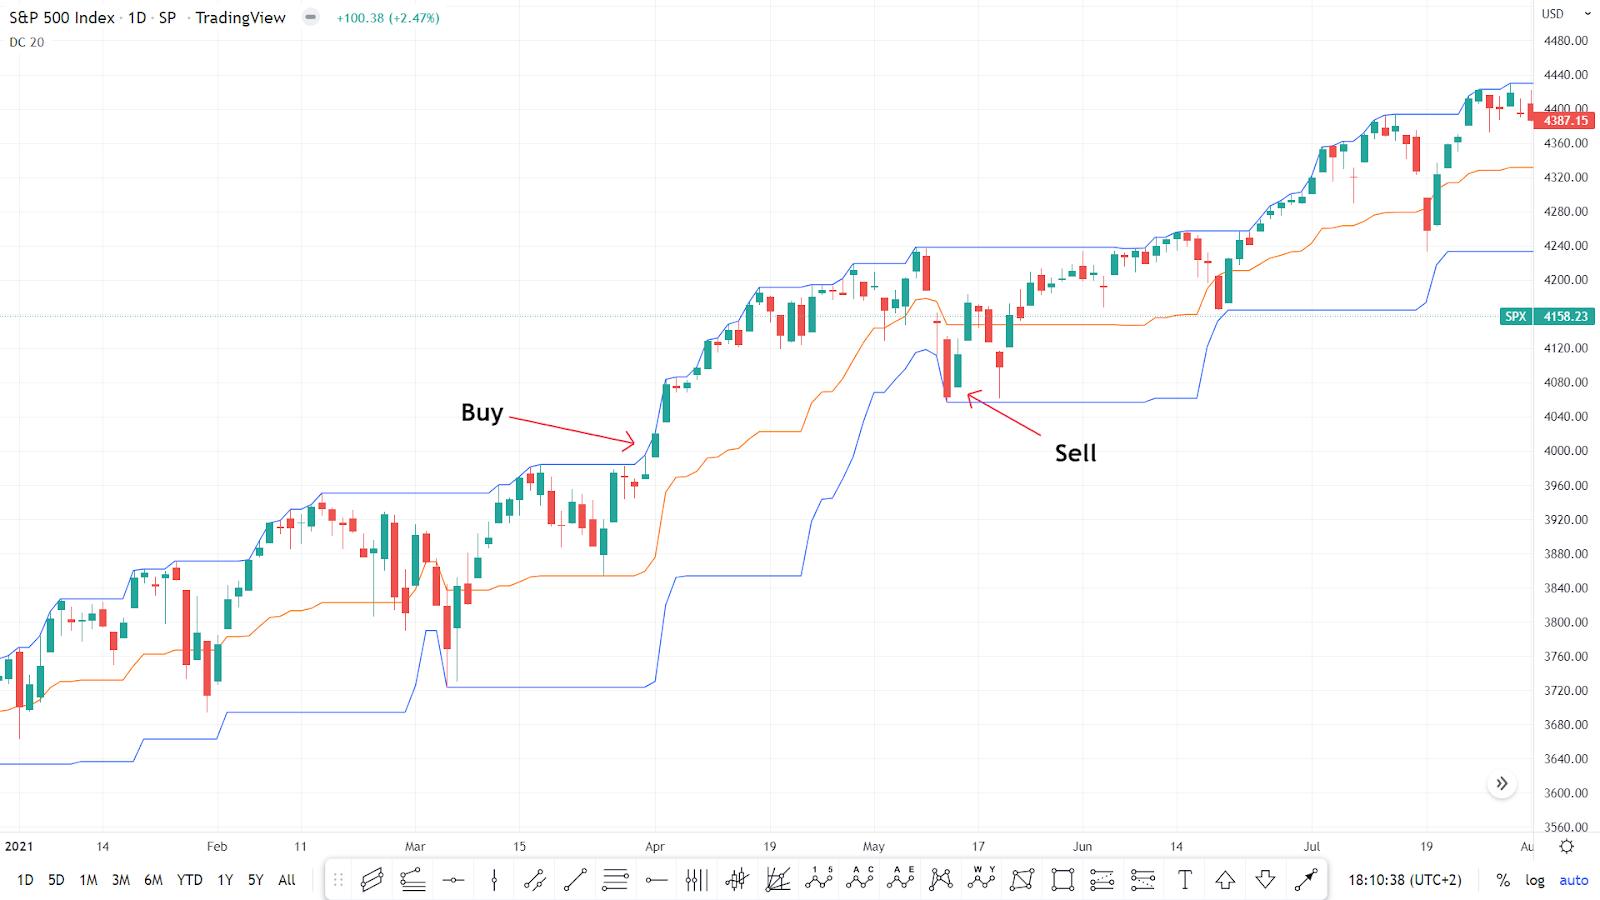
One of the most famous breakout systems is the Donchian channel, which is indicator used in market trading developed by Richard Donchian. It’s formed by taking the highest high and the lowest low of the last N periods. The area between the high and the low is the channel for the period chosen.
Figure 2 shows the S&P 500 chart with 20 Day Donchian channel. The buy signal is triggered when the price breaks above the 20-day high and the sell signal is triggered when the price breaks below the 20-day low.
Figure 2
2. Moving average trading
The moving average for a given day is equal to the average of that day’s closing price and the closing prices on the preceding N − 1 day, where N is equal to the number of days in the moving average.
Because the moving average is based on past prices, in a rising market, the moving average will be below the price. While in a declining market, the moving average will be above the price. Thus, when a price trend reverses from up to down, prices must cross the moving average from above. Similarly, when the trend reverses from down to up, prices must cross the moving average from below.
In the most basic type of moving average system, these crossover points are viewed as trade signals:
- A buy signal is generated when the shorter moving average crosses above the longer moving average.
- A sell signal is generated when the shorter moving average crosses below, the longer moving average.
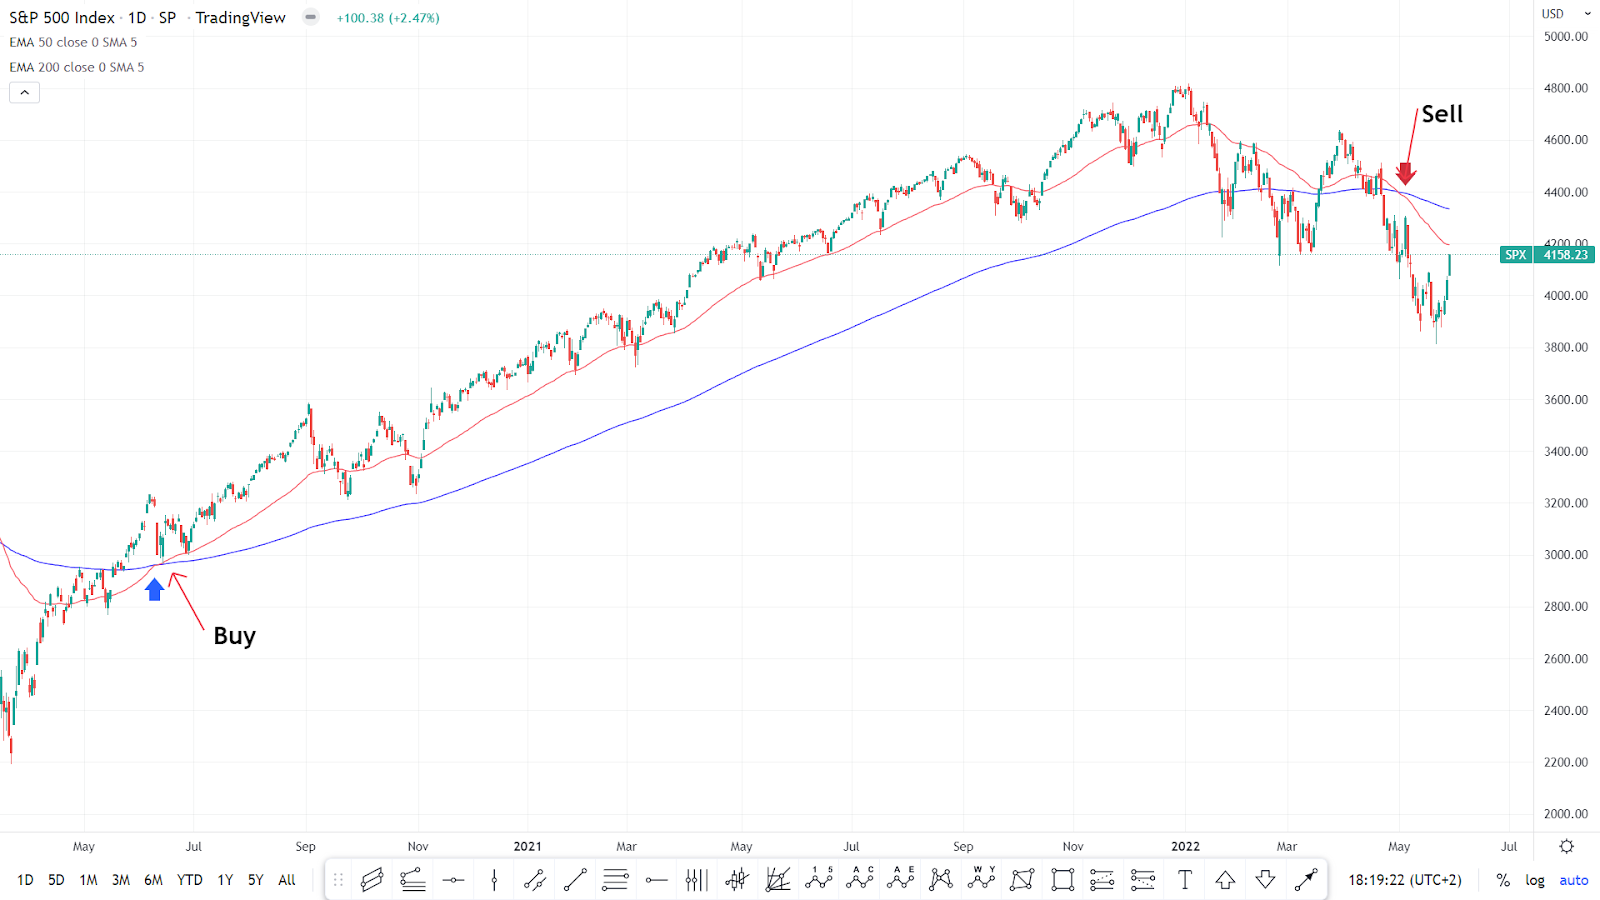
Figure 3 shows the S&P 500 chart with 50 EMA and 200 EMA. The buy signal is triggered when the 50 EMA breaks above the 200 EMA, and the sell signal is triggered when the 50 EMA crosses below the 200 EMA.
Figure 3
Pros and cons of position trading
There are pros and cons to position trading, such as:
Advantages of position trading strategies
- Position trading is a long-term strategy that can yield strong gains.
- Positions do not need to be looked at daily.
- Less stressful than other methods of active trading.
- Widely supported through technical analysis tools.
Disadvantages of position trading strategies
- As transactions might run for several months, a large amount of cash is required to keep positions open for an extended length of time.
- If the position stays open for a long period, swap fees can accumulate.
- They require strong technical analysis background.
- Often requires patience to recognize the long-term change i
Disclaimer: The content published above has been prepared by CFI for informational purposes only and should not be considered as investment advice. Any view expressed does not constitute a personal recommendation or solicitation to buy or sell. The information provided does not have regard to the specific investment objectives, financial situation, and needs of any specific person who may receive it, and is not held out as independent investment research and may have been acted upon by persons connected with CFI. Market data is derived from independent sources believed to be reliable, however, CFI makes no guarantee of its accuracy or completeness, and accepts no responsibility for any consequence of its use by recipients.


