
- Accounts
 Trading DetailsCFI AIHelp & SupportPartnership
Elliott wave theory

Introduction
The Elliott wave theory was developed by R.N. Elliott in the 1930s and popularized by Robert Prechter in the 1970s. Elliott studied stock market data across various indices and discovered that market forms the same types of patterns on a smaller timeframe (lesser degree) that it does on a longer timeframe (higher degree).
These patterns provide clues as to what might happen next in the market. According to the theory, it does not depend on what timeframe you are analyzing—market movements follow the same types of patterns.
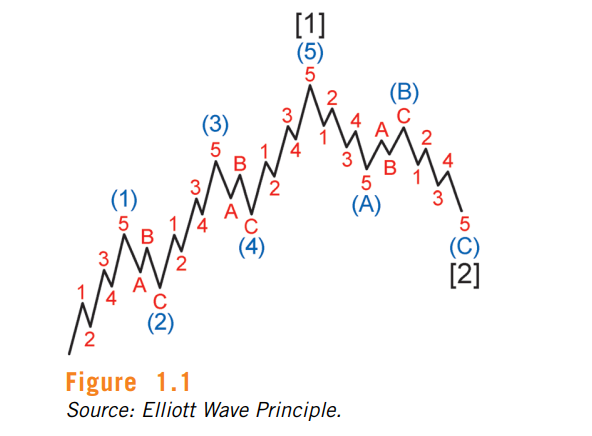
The Elliott wave theory suggests that stock prices move continuously up and down in the same pattern, known as waves, which are formed by the traders’ psychology. Elliott called these waves “motives” and “corrective.” Motives are waves that happen in an uptrend, while motives are those in a downtrend, as shown in Figure 1.
Figure 1
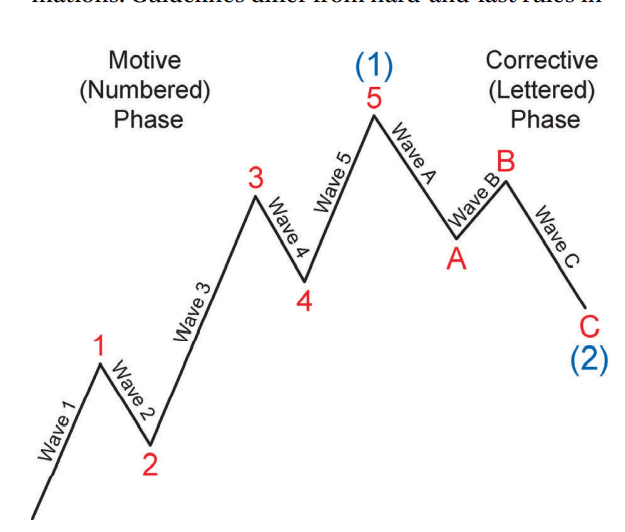
According to the theory, the stock market unfolds according to basic pattern of five waves up and three waves down to form one complete cycle of eight waves as shown in Figure 2.
Figure 2
Understanding motive and corrective waves
The two phases of the Elliott wave theory, which are broken down as:
Motive waves
Motive waves move in the direction of the main trend. Note that waves one, three, and five from Figure 2 are motive waves. There are two types of motive waves:
1. Impulsive wave
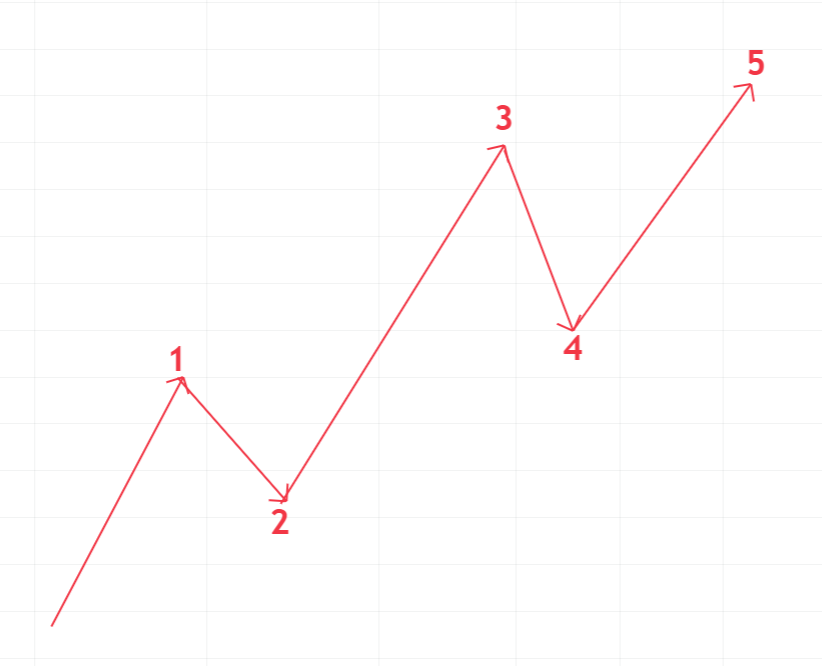
The impulsive wave has three unbreakable rules that define its formation:
- Wave 2 cannot retrace more than 100% of Wave 1
- Wave 3 can never be the shortest of waves 1, 3, and 5
- Wave 4 can never overlap Wave 1
If one of these rules is violated, the structure is not an impulse wave. As shown in Figure 3.
Figure 3
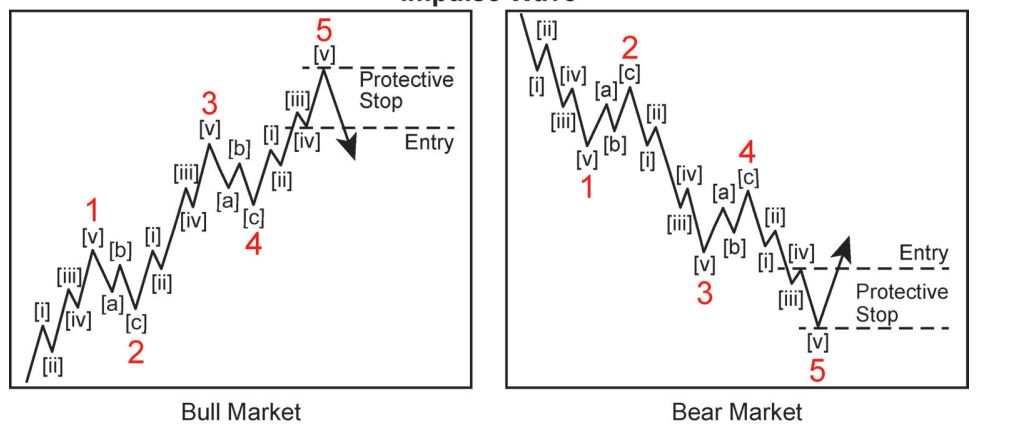
Trading using impulsive wave: Whenever an impulse wave is complete the trading technique is to enter on a break below the extreme of wave (iv) of 5 as shown in Figure 4. Set the initial protective stop at the extreme of the price move.
Figure 4
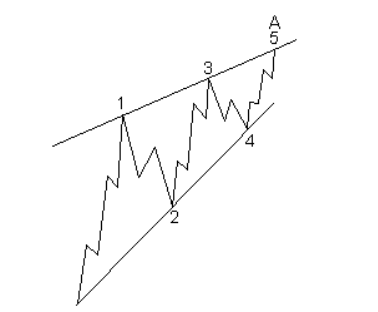
2. Diagonal wave
The diagonal wave looks like a wedge that may be either expanding or contracting. The diagonal rules are the same as the impulse wave rules except wave 4 could overlap with wave 1 as shown in Figure 5.
Figure 5
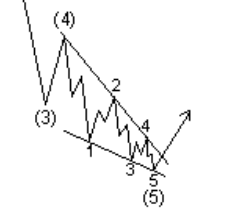
Diagonals can be further divided into the ending and leading diagonals. The ending diagonal usually occurs in Wave 5 of an impulse wave or the last wave of corrective waves whereas the leading diagonal is found in either the Wave 1 of an impulse wave or the Wave A position of a zigzag correction.
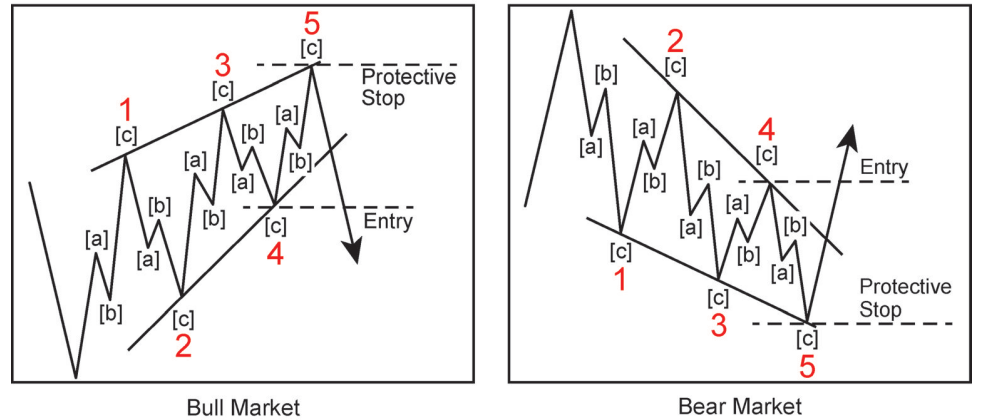
Trading using ending diagonal: Wait for a break of the extreme of wave 4 before taking a position and place the initial protective stop at the extreme of the price move as shown in Figure 6.
Figure 6
Corrective waves
There are four types of corrective waves:
1. Zigzag
The zigzag is a corrective wave that is made up of 3 waves labelled as A, B and C that move strongly up or down. The A and C waves are motive waves whereas the B wave is corrective (often with 3 sub-waves) as shown in Figure 7.
Figure 7

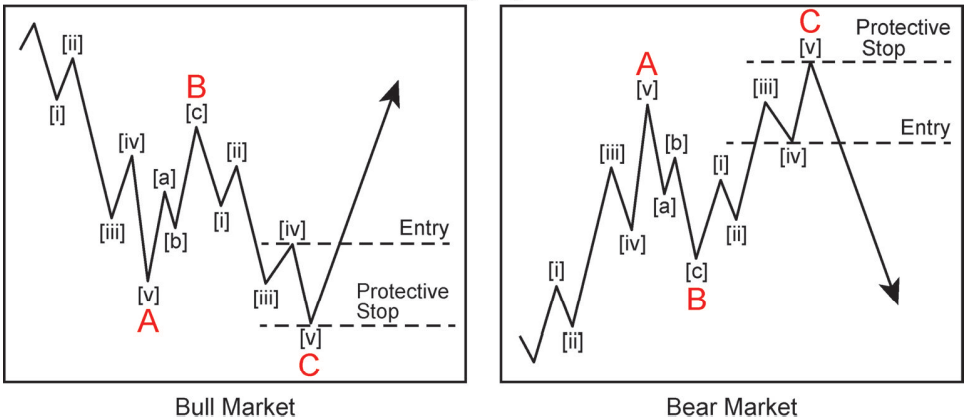
Trading using zigzag: Entering a trade during a zigzag is on a break of the extreme of wave [iv] of C, provided this level is beyond the termination of wave A as shown in Figure 8.
Figure 8
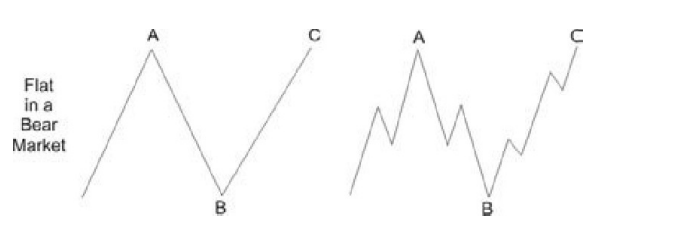
2. Flat
The flat is another three-wave correction in which the sub-waves are formed in a 3-3-5 structure which is labelled as an A-B-C structure. In the flat structure, both Waves A and B are corrective, and Wave C is motive having 5 sub-waves.as shown in Figure 9.
Figure 9
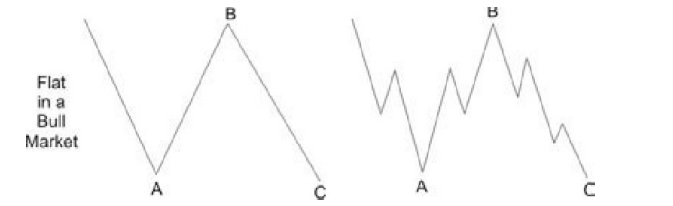
Trading using flat: The recommended entry technique is like that of an impulse wave, wait until prices exceed the extreme of wave (iv) of C to enter a trade as shown in Figure 10
Figure 10
3. Triangle
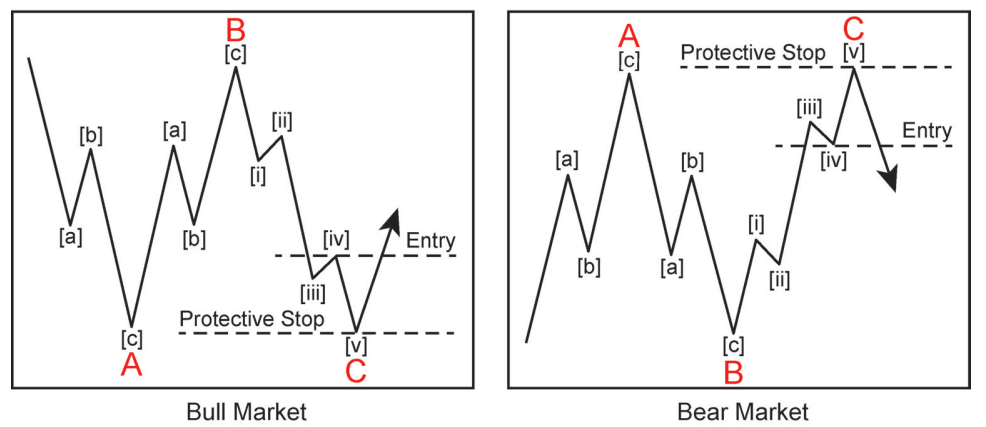
The triangle is a pattern consisting of five sub-waves in the form of a 3-3-3-3-3 structure, that is labelled as A-B-C-D-E. this corrective pattern shows a balance of forces and it travels sideways.
The triangles can also be categorized as symmetrical, descending, or ascending, based on whether they are pointing sideways, up with a flat top or down with a flat bottom.as shown in Figure 11.
Figure 11
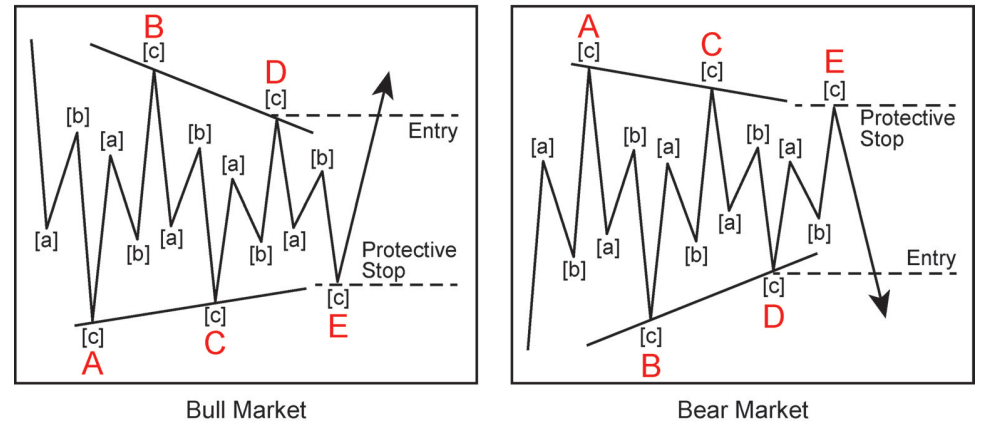
Trading using triangle: A triangle is a sideways price move—typically bounded by converging trendlines—that subdivides into waves A, B, C, D, and E. The entry guideline is to wait for prices to break the extreme of wave D and place an initial protective stop where wave E terminates. As shown in Figure 12.
Figure 12
4. Combinations correction
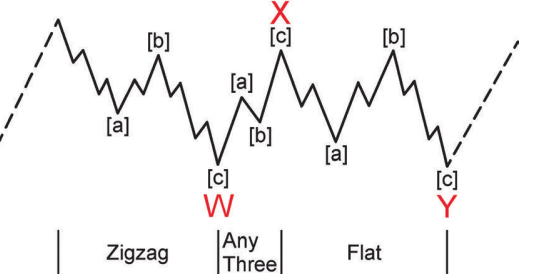
The combination could include two variations of corrective patterns such as zigzag followed by a flat as shown in Figure 13.
Figure 13
How can Elliot waves improve trading?
Here are five ways the following the Elliot wave theory can benefit traders:
- It can identify trends
- It can also identify countertrend price moves within a larger trend
- It determines the maturity of the trend.
- It provides high-confidence price targets
- It provides specific points of invalidation
Conclusion
As noted above, the Elliott wave theory is open to interpretations in different ways by different traders—so are their patterns. Take that into account when identifying these patterns. As you look for a trading opportunity, ask the question, “Do I see a wave pattern I recognize?” Look for one of the core Elliott wave patterns and go from there.
Disclaimer: The content published above has been prepared by CFI for informational purposes only and should not be considered as investment advice. Any view expressed does not constitute a personal recommendation or solicitation to buy or sell. The information provided does not have regard to the specific investment objectives, financial situation, and needs of any specific person who may receive it, and is not held out as independent investment research and may have been acted upon by persons connected with CFI. Market data is derived from independent sources believed to be reliable, however, CFI makes no guarantee of its accuracy or completeness, and accepts no responsibility for any consequence of its use by recipients.


