
- Accounts
 Trading DetailsCFI AIHelp & SupportPartnership
Simple candlestick patterns

Candlestick patterns are recurring formations of candlesticks that are made up of one or more candles. The simple ones are usually represented by one candlestick and can indicate, to a certain degree, the future direction of a trading product or at least hint at what could come next.
It’s important to remember that the bigger the time frame, the more important the candlestick pattern is and the bigger the expected move. Also, bigger candles are usually more indicating of what is happening than tight, and small candles which are rather indecisive in nature.
Let’s look at some of the most important simple candlestick patterns which are usually made up of one candlestick.
Marubozu
The marubozu is one of the easiest patterns to identify and read. Marubozu is the Japanese word for “Bald. Marubozu can appear anywhere in the chart, irrespective of the current trend. The textbook definition of a marubozu is a candlestick with no lower or upper shadows and mainly just a solid positive or negative body.
The marubozu comes in two types. A bullish and a bearish candlestick.
A bullish marubozu, shown in Figure 1, is a candle that opened at the low and closed at the high, indicating heavy buying throughout the period of the candlestick. Once a marubozu shows on the chart, it’s advised to buy near the close of the candle as the momentum is likely to continue for a few days.
Figure 1
A bearish marubozu, shown in Figure 2, is the opposite of a bullish one, with the open corresponding to the high and the close to the low of the candle. Here, traders should look to sell at the close and preferably wait for the end of the candle without anticipating as late hour or late day reversals are always possible.
Figure 2

Marubozu candles are great signals on their own but should still be taken into context. A bullish marubozu after a downtrend may lead to a correction and not necessarily a reversal.
Spinning top
The spinning top is an indecisive candlestick that is usually made up of a small body and an upper and lower shadow. The spinning top can be bullish or bearish in terms of close and by this, would be giving a minor bias.
In the case of a spinning top, the candle is showing both, bullish and bearish pressure, supported further by how it closes but the fact that it’s nearly symmetrical indicates indecisiveness and a lack of direction. They could mean a continuation of the trend or a reversal, based on context and how they are presented.
In a downtrend, the spinning top may indicate some consolidation, shown in Figure 3, or maybe an attempt by the buyers to lift prices higher, or both. Either way, it’s a pause in the trend and could lead to a new round of selling or, if the right bullish pattern shows up such as a Marubozu, a reversal could occur.
Figure 3
The same can be said about an uptrend. A spinning top after an uptrend could mean some selling pressure but the market could go either way from here. A bearish marubozu could lead to a reversal while bullish signs or a break higher could confirm a new round of buying.
Doji
Dojis, shown in Figure 4, are very similar to spinning tops except that dojis do not really have a body. Their body is either very small or non-existent, effectively eliminating the potential bias that spinning tops present.
Figure 4

More often than not, dojis will show up before or after spinning tops and within the same areas. They indicate indecision and a lack of direction but could be read the same way spinning tops are.
Similar to spinning tops, it’s important to see what lies ahead after a doji candlestick. Let’s assume a downtrend and a doji shows up, seen in Figure 5. For a reversal to occur, the next few candles should be hinting at a bullish sentiment, preferably with big bullish candlesticks or a marobuzo.
Figure 5

A downtrend with a doji could indicate new selling or a potential reversal. Again, it’s important to assess what comes after. A bearish candle could mean renewed selling while a bullish one could reverse the downtrend.
If multiple dojis show up, seen in Figure 6, this indicates growing indecision and could lead to a more powerful move once sentiment shifts.
Figure 6

Paper umbrella (hammer and hanging man)
Paper umbrella patterns refer to the commonly mentioned hammer and hanging nan candlesticks. A paper umbrella that shows up at the bottom of a downtrend is called a Hammer while one that shows up at the top or after an extended uptrend is called a Hanging Man.
For the paper umbrella to qualify, the lower shadow of the candle needs to be at least, twice as much as the size of the body.
Let’s take an in-depth look at both formations.
Hammer
A hammer candlestick, shown in Figure 7, occurs usually following an extended downtrend. It is made up of a small body near the upper range of that period and a long lower shadow. The longer the shadow, the more significant, and potentially bullish the pattern is.
Figure 7

Hammers can have bullish or bearish closes although a bullish body is usually more effective than a bearish one.
Let’s assume the market is trending lower but seems a bit overextended, shown in Figure 8. A hammer candlestick shows up, characterized by a push lower but a failure to close in the middle or near the lows, a clear indication that buying pressure prevailed. This suggests a long trade although the more conservative traders may choose to wait for further confirmation before getting in.
Figure 8

Hanging Man
The same pattern, shown in Figure 9, can occur after an extended uptrend. If the market has been trending higher and a Hanging Man occurs, it indicates some selling pressure and a potential market top. While the pattern is reliable, the fact that the price closed near the highs could be putting those sellers in danger.
Figure 9
Following a Hanging Man pattern, shown in Figure 10, a bearish candlestick is needed to confirm lower prices and put those sellers in profit. On the other hand, a break higher could endanger those positions and lead to liquidation, forcing prices higher once everyone is on the long side.
Figure 10

Shooting star
Shooting star candlesticks are basically inverted Paper Umbrellas. They can show up after extended uptrends or downtrends and are likely to indicate reversals.
Let’s assume an uptrend is in place. Suddenly, a shooting star, shown in Figure 11, shows up with traders pushing prices higher but sellers coming in later and moving prices lower where the candle eventually closes near the lows. Now whether the body is bullish or bearish is not of serious concern as the pressure is already present.
Figure 11
The conservative trader will look for bearish candlesticks after a shooting star, and if they do show up, would further confirm a reversal in place.
While shooting stars may not always lead to a reversal, it’s important to keep them in mind as they are indicating selling pressure anywhere. The more that effort consolidates and stops prices from going higher, the more likely a reversal is setting up.
Seeing a shooting start after a downtrend may indicate some buying pressure but further confirmation is needed to push prices higher and reverse the ongoing trend.
Setting a stop loss and taking profit
Remember that in trading, patterns are never guaranteed and may fail. Keep in mind two things, the more confirmation you can find, the better odds you have of turning a profit. Also, it’s important to set a stop loss and take profit on every position you take.
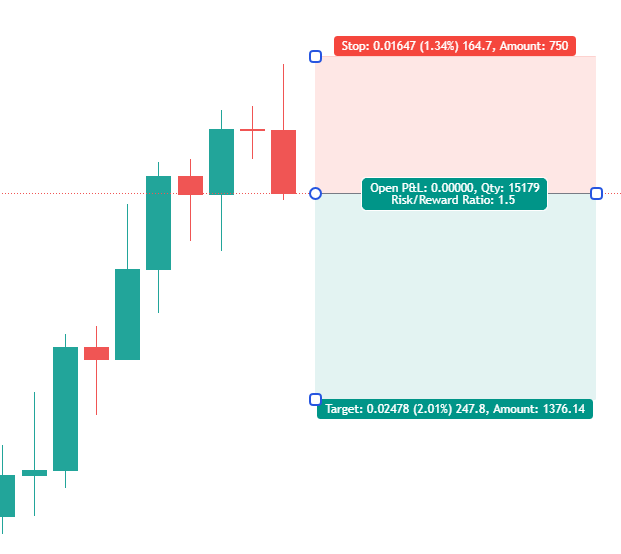
You should look to set your stop loss above or below the candlestick that showed the pattern and add a few pips for leeway. Occasionally, the market may spike in the opposite direction, take out your stop, and move towards your original target. If the candle is too small, consider moving your stop to above or below the most recent high or low. This is a strategic location that would invalidate the entire setup if breached.
In terms of taking profit, look for at 1.5 times your risk, shown in Figure 12. The bigger your target, the better your risk to reward ratio is.
Figure 12
Assuming you are losing 1 time per trade or making 3 times when your position reaches its target, this means that if you lose three trades, you only need to win one to cover your losses. Here is an in-depth look at trading stats:
- 10 trades
- 4 wins – 3x per win
- 6 losses – 1x per loss
In this case, you are making:
(3x) x 4 = 12x wins
(1x) x 6 = 6x losses
Ultimately, you have won 6x, or 6 times your initial risk.
Obviously, it is not as easy as this as sometimes targets are not reached or the market is consolidating which is leading to false signals but nonetheless, the approach should be as systematic as possible and trading should be treated as a business with no emotions and with math involved.
Conclusion
Regardless of your trading strategy, incorporating simple or advanced candlestick patterns will improve your odds and give you more confirmation and confidence before entering a trade.
These patterns happen often but you should always look at them in context. For those of you who are risk-averse, don’t enter once the pattern forms but wait for validation from the next one or more candlesticks.
For those who enjoy the riskier side of trading, feel free to get in once the pattern is completed and always use stop and targets to manage your position and risk.
Disclaimer: The content published above has been prepared by CFI for informational purposes only and should not be considered as investment advice. Any view expressed does not constitute a personal recommendation or solicitation to buy or sell. The information provided does not have regard to the specific investment objectives, financial situation, and needs of any specific person who may receive it, and is not held out as independent investment research and may have been acted upon by persons connected with CFI. Market data is derived from independent sources believed to be reliable, however, CFI makes no guarantee of its accuracy or completeness, and accepts no responsibility for any consequence of its use by recipients.


