
- Investing
 SpecialsAccountsTrading DetailsCFI AIHelp & SupportPartnership
The relationship between different financial markets

Intermarket analysis
Intermarket analysis focuses on analyzing multiple asset classes that are related. You may be wondering which asset classes are related, and the general answer is all of them. For example, stocks may be positively or negatively correlated to bonds or the dollar, which is part of the currency market. This concept was first mentioned and introduced in the book “Trading with Intermarket Analysis” by John Murphy.
According to the author, traders may find value and benefit in studying the relationships between different asset classes.
How intermarket analysis works
Intermarket analysis focuses on the correlation between different asset classes. Some markets move in tandem while others may move opposite of each other and occasionally, markets may show more randomness and could swing between positive and negative correlations. A good example of intermarket relationships involves the US stock market, which is highly connected with the bonds market, especially US corporate and government listings.
Different types of correlation
Positive correlation
A positive correlation (Figure 1) refers to two instruments or markets that move within the same direction. Correlation readings vary between 0 and 1 with the latter meaning perfect in tandem movements. This is rare but positive correlations between 0.7 and 0.9 are common and show a strong relationship between the two assets being studied. If the correlation is sustained for a long period of time, it could indicate a strong relationship that will always provide insight when analyzed.
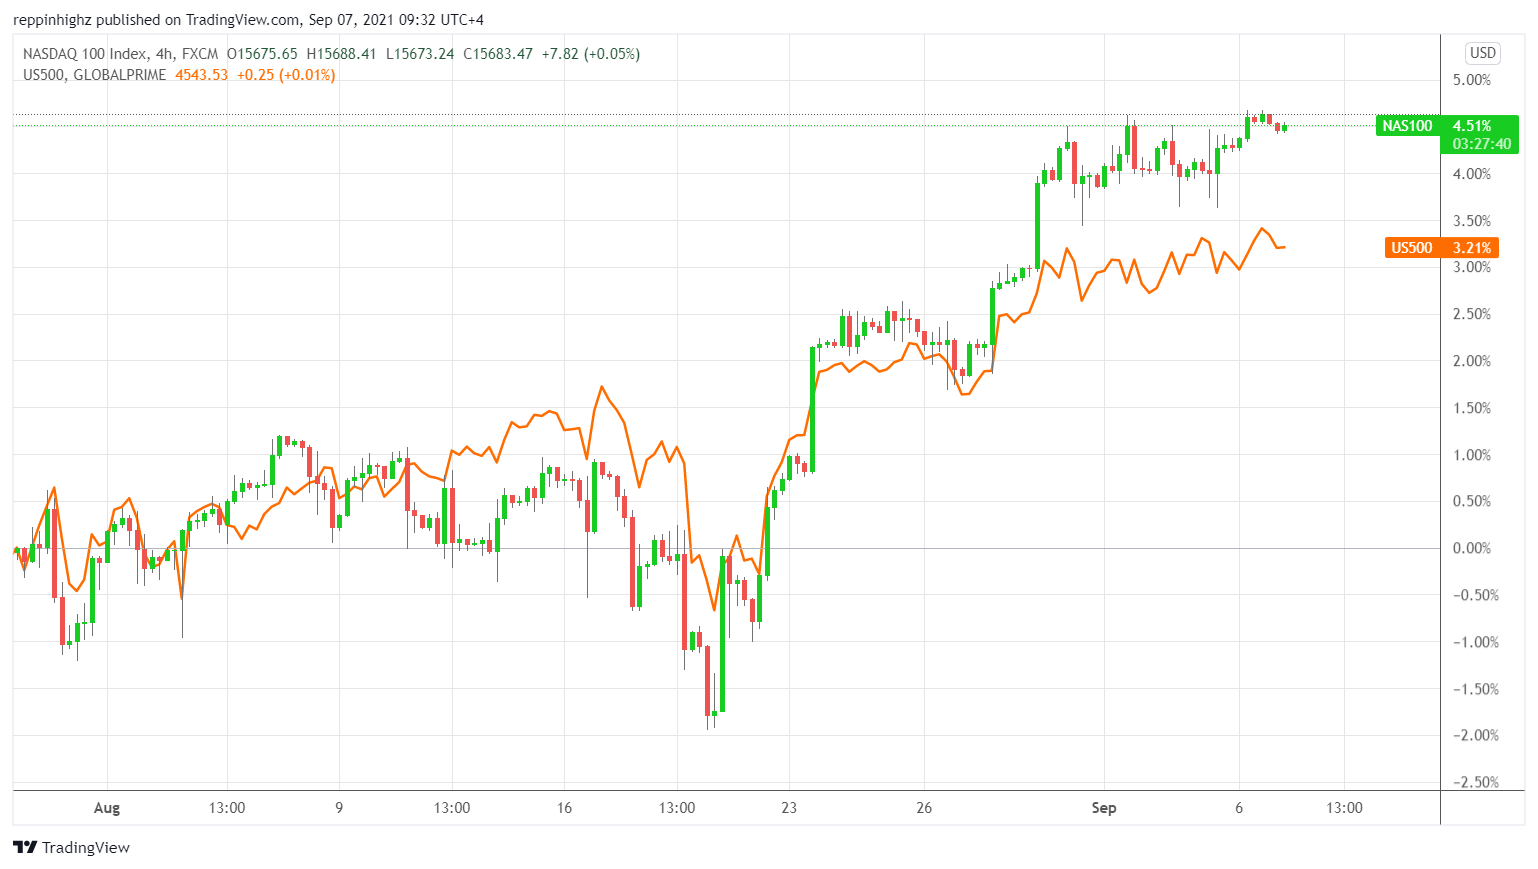
Figure 1 – 4-hour S&P500 and Nasdaq chart
Negative correlation
A negative correlation refers to two instruments or markets that move opposite of each other. Readings vary between 0 and -1. A reading of -1 would indicate a perfectly inverse relationship, however this rarely happens. Readings between -0.7 and -0.9 are common and show a strong inverse relationship between two assets or markets, especially if sustained for a long period of time. The closer the correlation is to 0, the weaker the relationship between the two assets or markets.
Deflationary and inflationary relationships
Inflationary
When inflation is on the rise, there is usually a positive correlation between bonds and stocks. In other words, when the value of bonds rise, stocks will theoretically rise as well. The occasional advantage found in this relationship is the idea that bonds typically change direction before stocks, so weakness may indicate a decline in stocks in the near term.
Within the same inflationary environment, there is usually a negative correlation between the US Dollar and major commodities, as well as between bonds and commodities. In this case, when the US Dollar rises, commodities will see lower prices and when bonds increase in price, commodities tend to decline.
Deflationary
During a deflationary period, there is a negative correlation between stocks and bonds. When the price of stocks increases, the price of bonds tends to decrease. At the same time, there is a positive correlation between stock prices and interest rates given that rates are inverse to the price of bonds.
Furthermore, past data has found a negative correlation between the US Dollar and commodities as well as between commodities and bonds. In this situation, the only positive relationship is between stocks and commodities.
Importance of using Intermarket analysis in your trading
Early warning signal
Regardless of the current environment or how positively or negatively correlated stocks and bonds are during a specific period of time, bonds and their associated interest rates play an important role in economies and are closely linked to the monetary policy of each country. Over time, bonds became an early warning system, as they tend to move and establish trends before stocks and other markets. Investors look for certain patterns or characteristics that denote the potential start of a new trend or any type of reversal within uptrends or downtrends.
Changes in correlation
Another interesting signal to watch for is when a highly positive or negative correlation breaks down (Figure 2). When such a disconnection happens, it could mean different things. One scenario may indicate that an asset may be undervalued or overvalued and will look to catch up with the other one. The opposite may occur with the overvalued or undervalued asset experiencing a sharp reversal to catch up with the more neutrally performing asset. This has given rise to pairs trading, a strategy that builds on disconnections between highly correlated assets. Another scenario could indicate a change in the trend or a potential reversal if the breakdown in correlation is sustained.
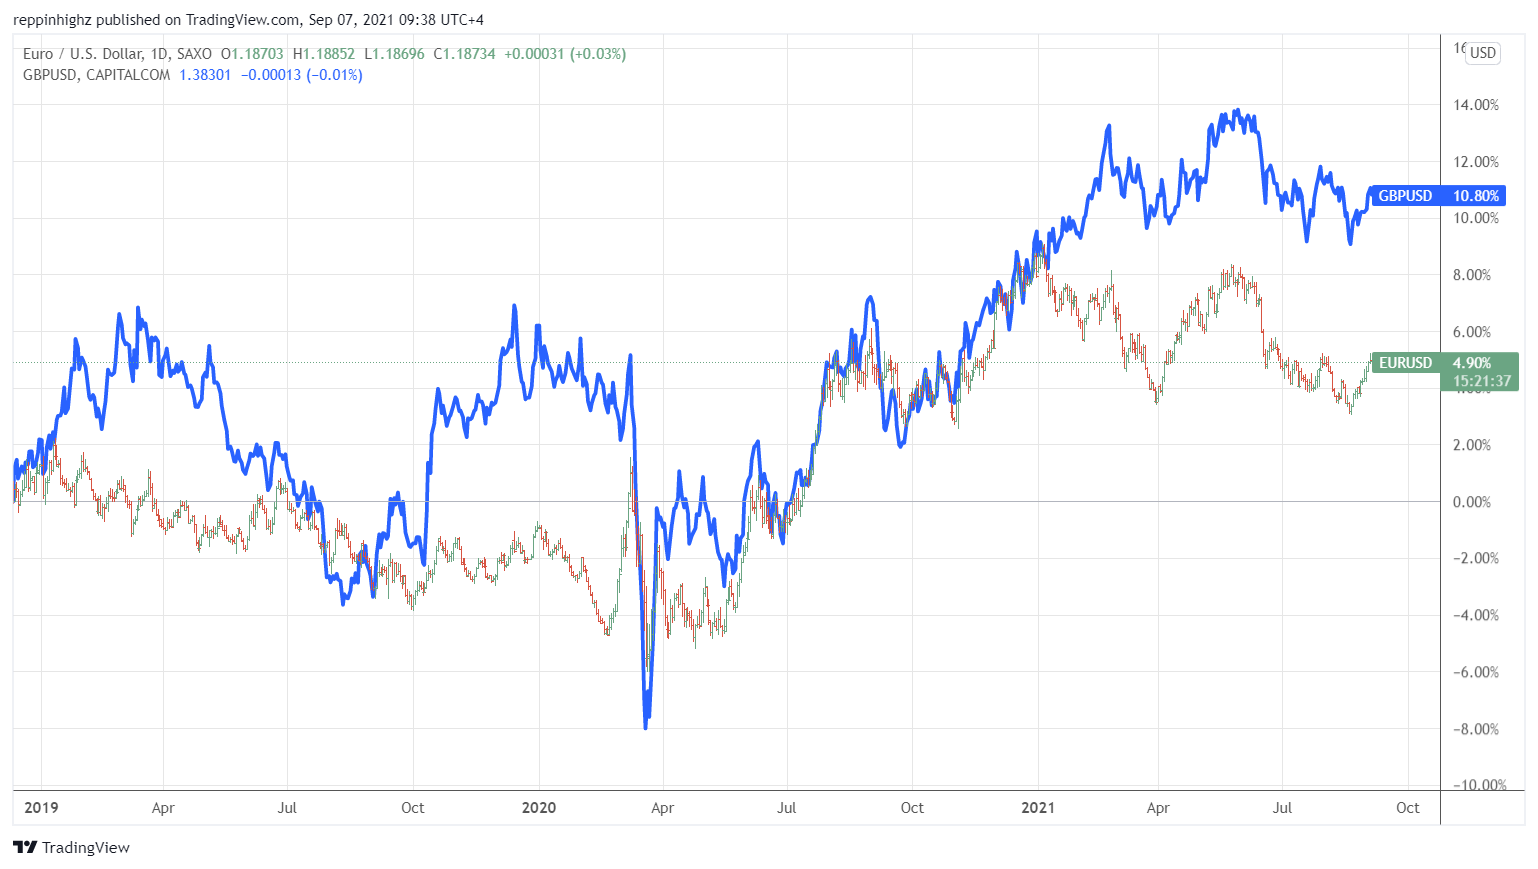
Figure 2 – Daily EURUSD and GBPUSD chart
Regardless of the scenario, a breakdown in correlation could indicate fundamental shifts that could affect both instruments, one way or another.
Technical analysis and Intermarket analysis
Whether bond markets are signaling a reversal, or a breakdown of correlation has taken place, it’s important to look for technical patterns that will help time entries for trades in support of your own intermarket analysis. This means applying traditional technical analysis to a situation that already contains a strong probability of a specific direction. In other words, technical analysis would complement intermarket analysis and help trades build more confirmation and confidence when looking to initiate a trade based on intermarket analysis.
How to calculate correlation
It is relatively easy to calculate correlation for two sets of data. Let’s assume the Dow Jones is “x” and the oil is “y”. Follow the below steps to learn how to calculate the correlation between two instruments:
Step 1: Find the mean of x and y
Step 2: Subtract the mean of x from every x value available and also do the same for y
Step 3: Calculate: a*b, a^2 and b^2 for every value
Step 4: Sum up ab, sum up a2 and sum up b2 (calculate the totals for each)
Step 5: Divide the sum of ab by the square root of [(sum of a2) × (sum of b2)]
Here is an example of a random set of data and its correlation:
| Dow Jones | Oil | x | y | xy | x^2 | y^2 |
| 12500 | 55.55 | 119.5 | -0.505 | -60.3475 | 14280.25 | 0.255025 |
| 12300 | 55.1 | -80.5 | -0.955 | 76.8775 | 6480.25 | 0.912025 |
| 12200 | 55.35 | -180.5 | -0.705 | 127.2525 | 32580.25 | 0.497025 |
| 12100 | 55.45 | -280.5 | -0.605 | 169.7025 | 78680.25 | 0.366025 |
| 12350 | 56.3 | -30.5 | 0.245 | -7.4725 | 930.25 | 0.060025 |
| 12415 | 56.15 | 34.5 | 0.095 | 3.2775 | 1190.25 | 0.009025 |
| 12700 | 56.9 | 319.5 | 0.845 | 269.9775 | 102080.25 | 0.714025 |
| 12580 | 56.8 | 199.5 | 0.745 | 148.6275 | 39800.25 | 0.555025 |
| 12450 | 56.85 | 69.5 | 0.795 | 55.2525 | 4830.25 | 0.632025 |
| 12210 | 56.1 | -170.5 | 0.045 | -7.6725 | 29070.25 | 0.002025 |
| 12380.5 | 56.055 | 775.475 | 309922.5 | 4.00225 | ||
| Median | Median | Sum | Sum | Sum | ||
| x^2 * y^2 | sq of x^2 * y^2 | xy/sq | ||||
| 1240387.326 | 1113.726773 | 0.696288 |
In this scenario, we see a correlation of 0.6962 which already indicates a strong positive correlation, and one that is really close to the 0.70 which is seen as a benchmark for a very positive relationship between two assets. Of course, in this example, the amount of data present is small, meaning it may not indicate a long-term or sustained correlation. Nonetheless, it still gives an idea of how two instruments can move together in opposite.
Microsoft Excel can help with quicker calculations of data as well as the ability to visualize the different sets of data for a better understanding of how certain markets move. It’s very possible to spot certain anomalies or patterns by just observing how two assets behave towards each other over a period of time.
Final thoughts
Studying intermarket relationships is not an easy endeavor and takes time to master. Such relationships can prove highly beneficial to traders as they can give guidance on when a certain instrument may be lagging or disconnected from another major one that is known to be persistent in its moves. It all boils down to how a trader uses these which means taking the time to learn and understand the relationship between different assets and the ones that act as an early warning or have proven to hint at sudden moves or reversals.
Disclaimer: The content published above has been prepared by CFI for informational purposes only and should not be considered as investment advice. Any view expressed does not constitute a personal recommendation or solicitation to buy or sell. The information provided does not have regard to the specific investment objectives, financial situation, and needs of any specific person who may receive it, and is not held out as independent investment research and may have been acted upon by persons connected with CFI. Market data is derived from independent sources believed to be reliable, however, CFI makes no guarantee of its accuracy or completeness, and accepts no responsibility for any consequence of its use by recipients.


