CFDs are leveraged products that incur a high level of risk. Know more

- Accounts
 Trading DetailsCFI AIHelp & Support
What is Technical Analysis
Advanced Candlestick Patterns
June 28, 2024

Advanced candlestick patterns, made up of 2 or 3 candlesticks, are powerful signals that traders can use to enter positions or for further confirmation. There are several advanced candlestick patterns you’ll want to be familiar with:
Engulfing
Let’s start with the engulfing pattern. Engulfing patterns are made up of 2 candlesticks with the first one being a rather small one while the second a much bigger one, engulfing the previous one to the upside or downside.
Bullish engulfing patterns, shown in Figure 1, tend to occur after a downtrend and the ideal ones will have a bearish candlestick followed by a bullish candlestick that completely engulfs the body of the previous candlestick and preferably covers its high and low, when possible.
Figure 1
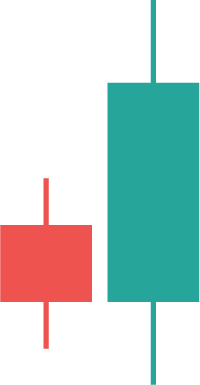
The logic behind a bullish engulfing candlestick starts with traders attempting to continue the downtrend following a bearish candle. Suddenly, heavy buying comes in, rattling the sellers and moving prices above the close of yesterday’s candle and eventually, above its body.
At this point, sellers are panicking and concerned that buyers are too strong. They might consider exiting their short positions, further pushing prices higher and leading to the candle closing near the highs or at least at a much higher level for that time period. An engulfing pattern with an upper shadow is still considered valid but the bigger the body, the stronger the momentum and buying.
The opposite applies for bearish engulfing, shown in Figure 2, which happens after an uptrend and indicates that sellers are coming in strong and ready to push prices lower. In this case, the reversal will continue over the next few bars and could be a large-scale one or a simple correction of the current trend.
Figure 2

Doji after Engulfing
A worthy pattern to mention would be the presence of an Engulfing candlestick followed by a doji, shown in Figure 3. Let’s assume an uptrend, where we see that the market is moving higher, then a bearish engulfing shows up, setting the stage for a reversal. The next candlestick ends up being a doji which indicates uncertainty.
Figure 3
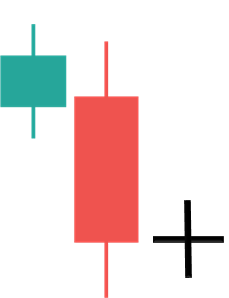
The uncertainty applies to the main trend and causes concern for the buyers especially after having suffered a shakeout by the bearish engulfing. Such a pattern leads to a sharp decline in price and is noted for its trustworthiness and strong action afterward.
Piercing
The piercing candlestick pattern, shown in Figure 4, is very similar to an engulfing pattern but the piercing only needs to cover between 50% and 100% of the previous candle. It’s a more flexible pattern to look for and still indicates a bit of reversing momentum but should be taken in context.
Figure 4

The piercing pattern is telling you that buyers are attempting to regain control and could set the tone for a bullish move. Risk average traders may want to wait for a bullish candlestick afterward while those who do not mind the added risk could look to enter at the close of the piercing pattern.
Dark cloud cover
The opposite of the Piercing pattern, the dark cloud cover pattern, shown in Figure 5, behaves in a similar manner to a bearish engulfing but only needs to cover 50% to 100% of the previous candlestick before it’s confirmed.
Figure 5

The dark cloud cover usually happens after an uptrend and indicates selling pressure. Ideally, it’s best to wait for a bearish candlestick afterward before considering a sell position.
Harami
The harami pattern consists of two candlesticks with the first one being a larger one and the second having a smaller body. They are usually opposite with the first one being bullish and the second bearish or vice versa.
Bullish harami
The bullish harami presents itself after a downtrend in the form of a big bearish candlestick followed by a smaller bullish candlestick within the range of the previous candlestick, as shown in Figure 6.
It denotes a possible reversal as sellers could not keep the momentum going and buyers managed to stop the drop and hold prices. A bullish candlestick afterward is enough evidence of trapped sellers and higher prices.
Figure 6

Bearish harami
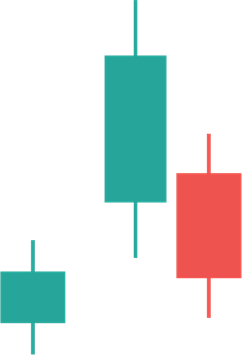
The opposite of a bullish harami, a bearish harami usually forms after an uptrend, shown in Figure 7. The pattern starts with a big bullish candlestick followed by a smaller bearish candlestick contained within the range of the previous candlestick.
Here, buyers failed to push prices higher, and sellers are attempting to control and reverse the market. A bearish candlestick afterward could give the confirmation needed for sellers to go short and expect lower prices.
Figure 7

Gaps
Gaps, shown in Figure 8, can be found across all markets, however the occurrence of them happening are higher after the market closes during the weakened. They usually occur whenever we have major events or news that might affect specific instrument on its opening day.
Let’s say something positive happened during the week regarding the U.S market, we might witness a gap to the upside on Monday.
Figure 8
Historically speaking, whenever a gap is formed, there will be a higher probability of retesting this gap and close the prices not reached.
Morning star
The morning star, seen in Figure 9, is a bit more complex and involves 3 candlesticks. They usually appear following a downtrend and are made up of a large bearish candlestick, followed by a doji or spinning top, and finally a bullish candlestick.
What happened here highlights a failure by the sellers to take prices lower, indecision as indicated by the doji or spinning candlesticks, and a reversal as hinted by the bullish candlestick. This is a classic pattern where prices failed to go lower and buyers took control and reversed the market higher.
Figure 9

The morning star pattern could happen after a downtrend or within corrections during uptrends which tells you that the market is set to continue higher.
Evening Star
The evening star, seen in Figure 10, is similar to a morning star but tends to happen during uptrends and could indicate a potential reversal lower. They consist of a bullish candlestick, followed by a doji or spinning top, and finally a bearish candlestick, indicating sellers took control from the buyers. From here, the price should head lower especially if the third candlestick is a very bearish and big one.
Figure 10

Evening Star patterns can occur during uptrends or within corrections during downtrends to signify that the downtrend is set to continue.
Conclusion
Candlestick pattern have been in the market for over 200 years now, which proves that their use in the market is essential in technical analysis. However, it is always better to combine with other confirmations in order to make up your mind regarding a specific position as well.
Disclaimer: The content published above has been prepared by CFI for informational purposes only and should not be considered as investment advice. Any view expressed does not constitute a personal recommendation or solicitation to buy or sell. The information provided does not have regard to the specific investment objectives, financial situation, and needs of any specific person who may receive it, and is not held out as independent investment research and may have been acted upon by persons connected with CFI. Market data is derived from independent sources believed to be reliable, however, CFI makes no guarantee of its accuracy or completeness, and accepts no responsibility for any consequence of its use by recipients.


