
- Trading
 AccountsTrading DetailsEducationCFI AICompanyHelp & Support
How Interest Rate Changes Affect the Markets

Interest rates are a key tool for managing monetary policy. Interest rates refer to the cost of borrowing money. There are two types of interest rates, nominal and real interest rates.
The nominal interest rate does not account for inflation, while the real interest rate is adjusted for inflation; thus, reflecting the cost of borrowing. Interest rates are scrutinized closely by investors as it affects both the micro and macro-economy.
Two common terms regarding interest rates are: hawkish, which means an increase in interest rates, and dovish, which means a decrease in interest rates.
Interest rate changes and the money market
A change in interest rates affect money markets, which are a type of financial market with short-term, high liquidity assets that are interchangeable on short notice. Key short-term debt instruments include money market funds, short terms certificates of deposits (CDs), and Treasury bills (T-bills).
There is a negative relationship between bond prices and interest rates. If you are an investor with a bond that you bought at a par value of for $100 paying a coupon of 2% semi-annually, and the central bank decides to increase interest rates to 5%, then you'd be more willing to dump your bond at a lower price to benefit from the higher interest rates.
Or you'll buy the bond at discount to offset the loss from the higher market rate. And if the market rate (interest rates) are lower than your bond's yield, you'll get it at a premium, which means you'll buy it at a higher price than its par value to offset the
An example of the changes in capital markets based on interest rate changes is shown in the Figure 1.
Figure 1
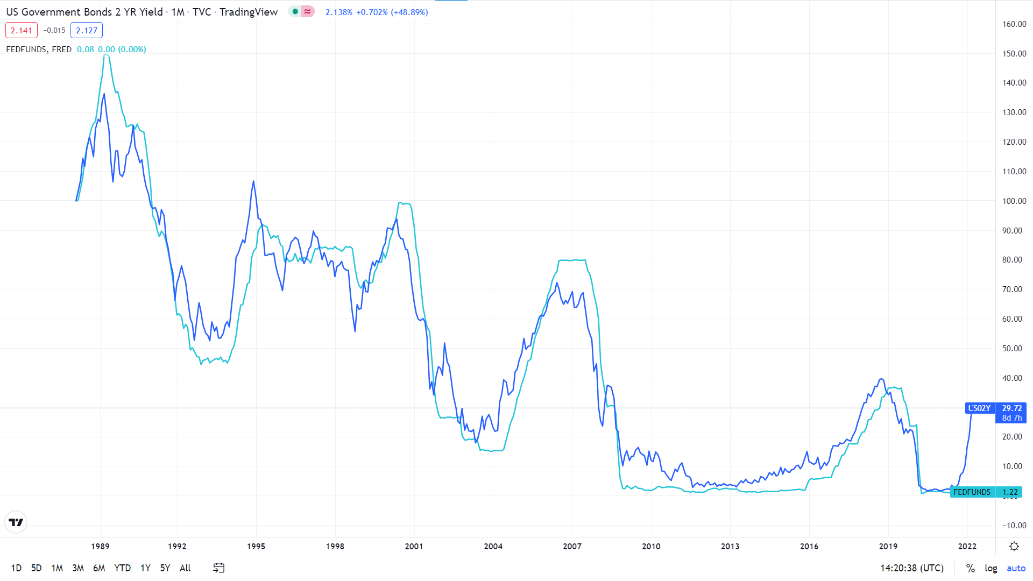
To precisely measure the sensitivity of the bond's price to changes in the interest rates, we calculate the duration sensitivity. Duration can be calculated by two methods: Macaulay duration (MacD) and the modified duration (ModD).
Where: CF = cash flow amount, f = cash flow number, y = yield to maturity, k = compounding periods per year, k = compounding periods per year, tf = time in years until cash flow is received, and PV =present value of all cash flows.
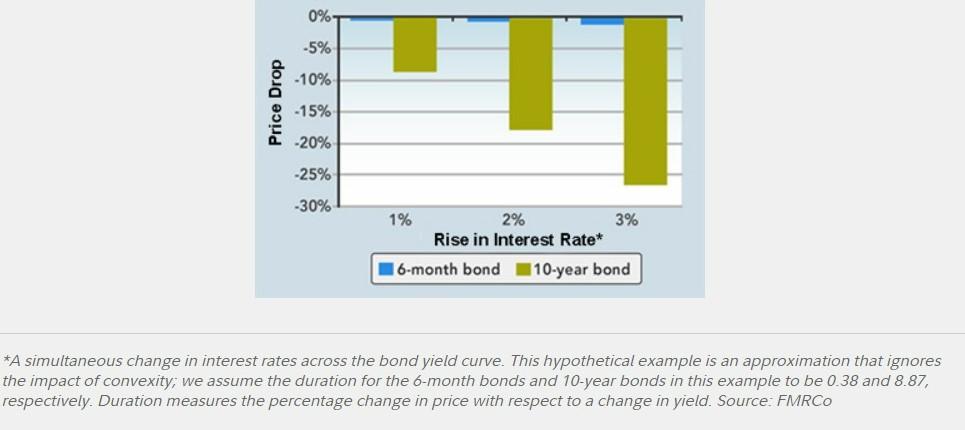
A bond with a longer time to maturity is more price-sensitive to interest rates, which means it has a larger duration than a short-term bond, hence the term duration. In simpler words, if a bond that has only two payments left that pay 5%, and an interest rate hike pushed the rate to 1%, then the investor will only be underpaid for 2 payments.
This is unlike another investor who bought a 30-year bond with 5% interest, who will be underpaid for the next 30 years, which will cause a larger decline in the long-term bond’s price than that of the short-termed, shown in Figure 2.
Figure 2
On the other hand, the capital market or the equity market refers to the market where long-term securities are bought and sold, such as the stock market. A change in interest rates affect it as well.
According to a study by Nasdaq (November 2021), growth and tech stocks benefit the most from interest rate changes. The Nasdaq index has the highest sensitivity to rate changes, compared to the Dow Jones and S&P 500.
There is not a clear relationship between the stock market and interest rates, however. Lower interest rates do not necessarily mean a higher stock price and vice versa. The effect differs in the short-term versus in the long-term, and day traders are affected differently than investors who prefer to buy and hold.
The Dow Jones analyzed the movement of the three main indices during five interest rate hikes, and the results showed that the indices were negative only once during the period-—June 1999 to Jan 2001, as seen in Figure 3.
Figure 3
| Rate Hike Cycle | DJIA | S&P 500 | Nasdaq |
| Feb. 1994 to July 1995 | 16.30% | 13.80% | 18.10% |
| March 1997 to Sept. 1998 | 17.40% | 32.60% | 40.00% |
| June 1999 to Jan. 2001 | -1.60% | -5.00% | -13.30% |
| June 2004 to Sept. 2007 | 28.70% | 30.00% | 26.90% |
| Dec. 2008 to July 2019 | 213.70% | 243.10% | 442.00% |
| Average % Change | 54.90% | 62.90% | 102.70% |
| Median % Change | 17.40% | 30.00% | 26.90% |
An increase in the Fed rate shows mixed signals, as shown below in Figure 4.
Figure 4
| Fed Rate Hike | Next 6 Month | Next 12-Month |
| Feb-1994 | -2.60% | 2.50% |
| Jun-1999 | 9% | 8% |
| Jun-2004 | 7.80% | 7.50% |
| Dec-2015 | 1.40% | 11.30% |
| Average | 3.90% | 7.30% |
As interest rates increase, businesses incur higher borrowing costs and lower future cash flow accompanied by weakened consumer demand; thus, adversely affecting their stock prices. The resulting expectations of a market decline makes investing in the stock market less desirable, and investors tend to turn to the other investment strategies.
However, not all stocks are adversely affected by increasing interest rates. Stocks in the financial industry, for instance, benefit from the rising environment since a higher interest rate means higher earnings for lending. While rising interest rates can hurt growth stocks, like tech companies, who depend heavily on financing for their operations.
Interest rate changes and economic growth
Changes in interest rates impact the macro-economy indirectly, including inflation, employment rates, and economic growth. A change in interest rates can occur due to a change in expected inflation. There are two types of real interest rates: Ex-ante real interest rates are adjusted for expected changes in the price level, while the ex-post real interest rates are adjusted for actual changes in the price level. As seen in the below equation, any change in the inflation rate affects interest rates, and vice versa:
i= ir + πe
Where: i = nominal interest rate, ir = real interest rate, πe = expected inflation rate
The above equation shows that as expected inflation rises, nominal interest rates rise. This positive relationship is called the Fisher Effect. In other words, interest rates rise as inflation rises because moneylenders demand higher interest rates to compensate for the decreased purchasing power.
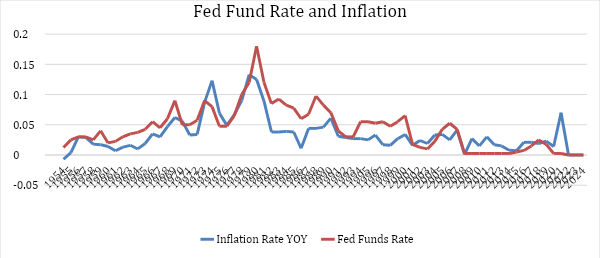
There is a positive relationship between the Fed funds rate and inflation, as they both move in tandem, as seen in Figure 5. Therefore, the real interest rate is a better indicator of the tightness of credit market conditions than the nominal interest rate.
Figure 5
At times of inflationary pressure, central banks tend to increase interest rates with moderate hikes. They hope to incentivize investors to save their money at the bank rather than spend it, reducing the money supply to stabilize inflation to normal levels, and driving interest rates to normal levels.
For example, as global inflation figures rose in late 2021 and early 2022, central banks around the globe decided to increase interest rate. The Bank of England (BOE) increased the interest rates three straight times.
Meanwhile, during times of slow economic growth, central banks decrease interest to encourage borrowing and spending.
Interest rates and stock market crashes
A stock market crash happens when stock prices fall quickly in a short amount of time. There are six stock crashes in the history of the stock market: 1929, 1987, 1999-2000, 2008, 2010, and 2020.
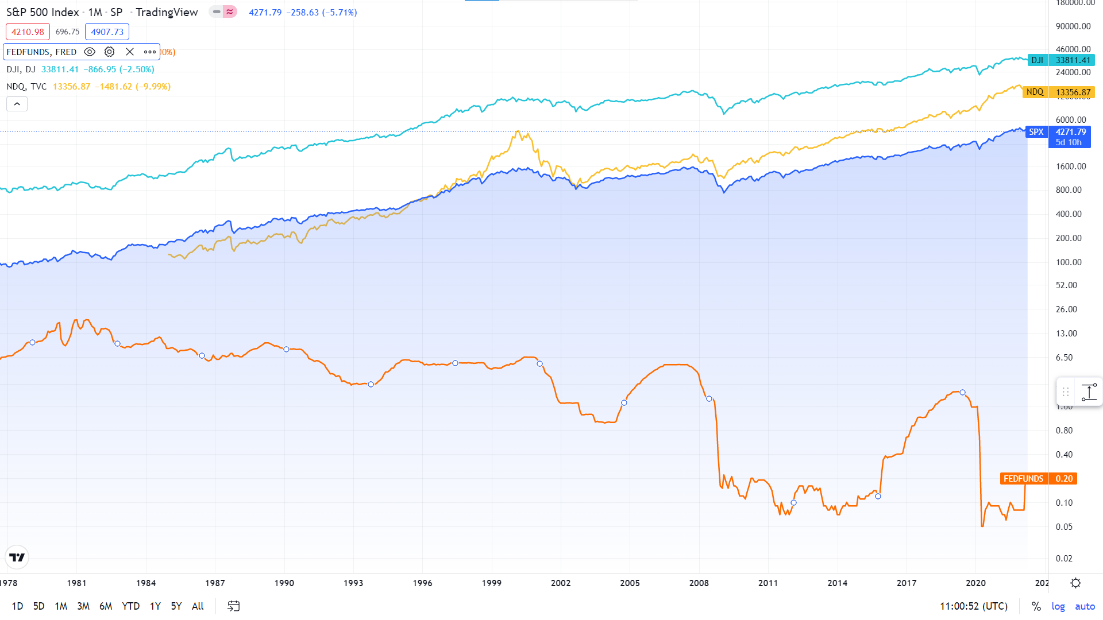
Figure 6 shows the performance of the S&P 500, Nasdaq, and Dow Jones versus the effective Fed funds rate. During the 2008 financial crisis, for instance, the three indices and the Fed funds rate moved in tandem, increasing and declining heavily together.
Figure 6
Disclaimer: The content published above has been prepared by CFI for informational purposes only and should not be considered as investment advice. Any view expressed does not constitute a personal recommendation or solicitation to buy or sell. The information provided does not have regard to the specific investment objectives, financial situation, and needs of any specific person who may receive it, and is not held out as independent investment research and may have been acted upon by persons connected with CFI. Market data is derived from independent sources believed to be reliable, however, CFI makes no guarantee of its accuracy or completeness, and accepts no responsibility for any consequence of its use by recipients.


