
- Trading
 AccountsTrading DetailsEducationCFI AICompanyHelp & Support
What is Fundamental Analysis in Trading?

Fundamental analysis is a broadly used method of analyzing an entire market, an asset class, a sector, and even a specific company. Fundamental analysis focuses on the key economic and financial figures of the asset in question and gauges the current strength or weakness based on those numbers. It’s divided into two areas—one focuses on general assets or markets while the other analyzes companies which could prove to be beneficial stocks to buy or sell.
Types of fundamental analysis
Economic analysis
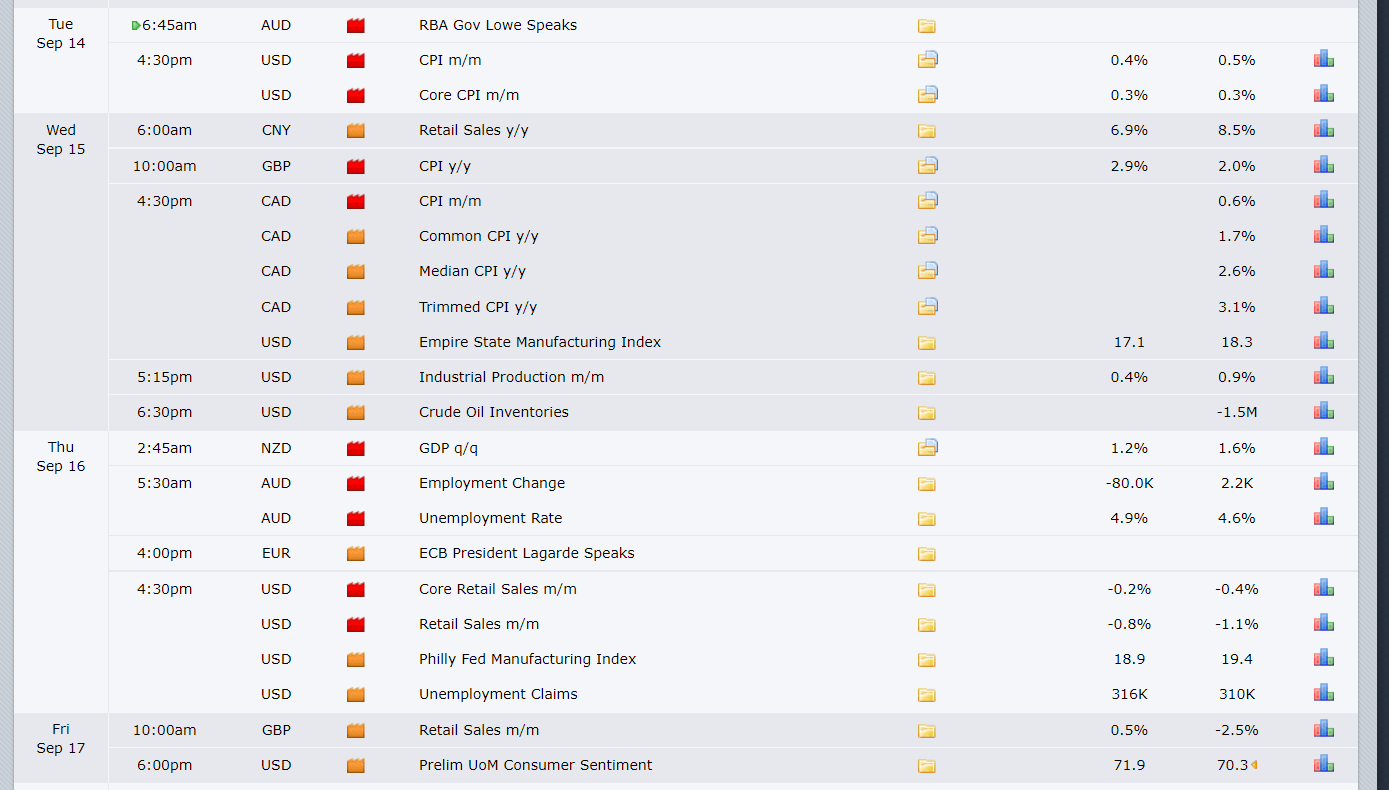
This part is centered around economic figures, shown in Figure 1, such as PMI data, employment figures, and even central bank decisions and interest rate changes. Economic analysis is more useful when looking at the broader picture such as analyzing a sector or the entire stock market of a country as well as assets such as currencies and commodities.
Figure 1
Company analysis
Company analysis studies the data of companies such as earnings, revenues, operating costs, and many other figures and ratios that would help determine the overall health of a specific company. Such analysis is common in the stock trading world where analysts study companies and periodically adjust their recommendations and analysis based on new facts and figures.
Application of fundamental analysis
Long-term trading
Fundamental analysis is seen as the opposite of technical analysis where the latter analyzes the history of a trading product and studies price patterns to create a certain outlook based on historical statistics. Nonetheless, they can easily complement each other and would serve as a powerful trading system when combined together.
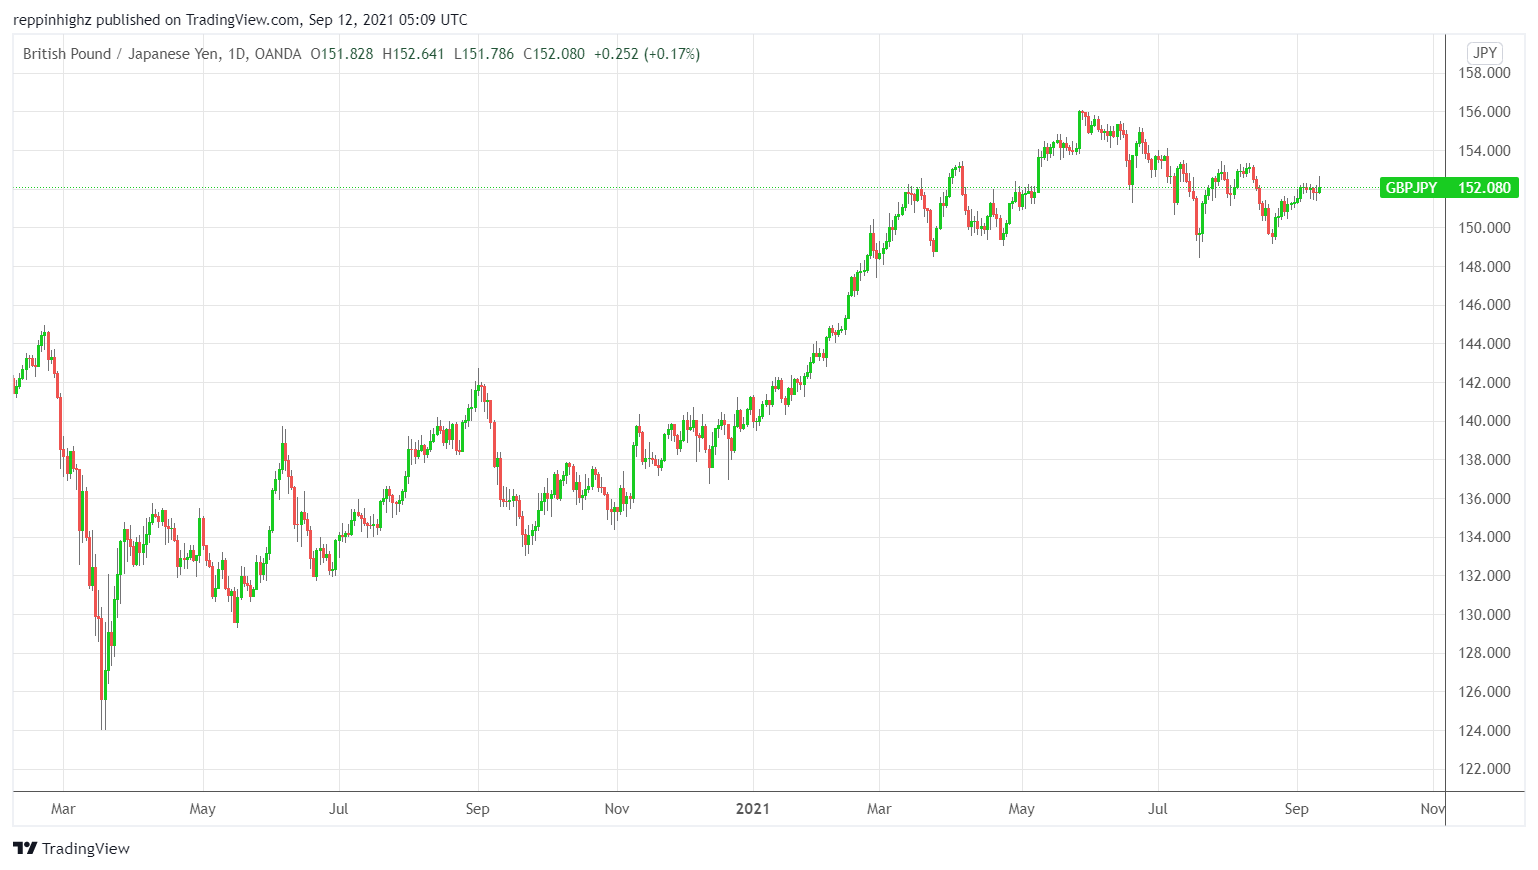
Fundamental analysis can be used for nearly any product or market yet its focus is on the long term, shown in Figure 2, given that the data under study is somehow lagging and usually has a delayed effect.
Figure 2
Long-term traders as well as swing and position traders include economic or company analysis in their strategies which helps them gauge the long-term strength or weakness of an asset. Long term trends are usually fueled by factors such as interest rate differential, economic discrepencies between countries and general order flow, among other possible reasons.
Once an outlook is set in place, it’s usually enough for them to initiate positions but, the integration of technical analysis could help them find better entry points as well as price targets, in line with the original direction.
This applies to both, economic analysis which involves markets, sectors, or specific products as well as company analysis which focuses on a specific stock.
For long-term traders, their focus should be on data that will play a role in dictating long-term direction such as interest rates, central bank decisions, employment rate evolution, and GDP trends.
Volatility trading
Given the volatility associated with economic data at the moment of release and onwards, some traders enjoy trading the fast and powerful swings that could take place on different instruments. This is the only instance where short-term traders are interested in economic or fundamental analysis and that is for the sake of pinpointing volatile moments.
For Volatility traders, they can use a variety of economic figures including the ones that are known to have a milder effect in the market. The idea is that volatility traders will look for anything that could shake up the market a bit.
Reverse confirmation
For long-term traders who are strictly focused on trading with technical analysis, a quick look at the fundamentals of a specific product or market could help tell them if they are positioned in the right direction. For example, a technical setup is showing very bullish on an instrument despite sentiment being neutral or slightly bearish. In this case, a study of the fundamentals could help verify if this sentiment is valid or simply traders positioned on the wrong side or having an off opinion about a product.
In this case, long-term technical traders can look at broader data than those with a fundamental focus because any sign that validates their technical outlook is welcomed.
Stock and ETF trading
When it comes to company analysis, traders can analyze in a variety of ways given the large number of useful data that can be studied. One ratio worth mentioning is the P/E or “Price to Earnings” ratio which measures how much investors are willing to pay compared to earnings. This shows if the market is overvaluing or undervaluing the company.
Another important figure is the “Return on Equity” which tells us how capable management is and measures the returns that shareholders are getting from the business. This is calculated by dividing net income by shareholder equity
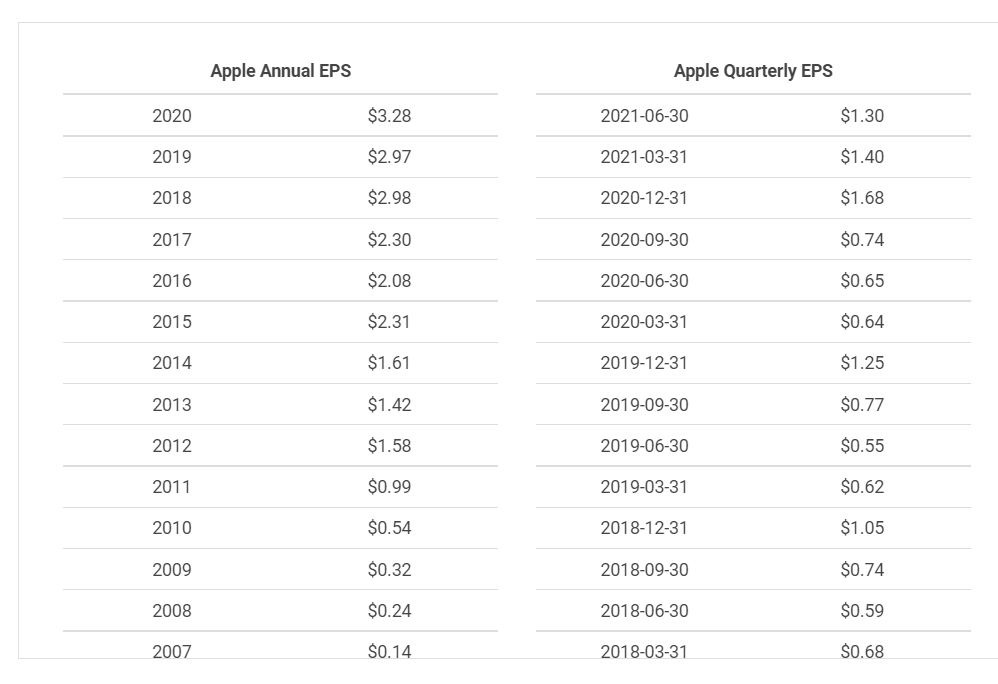
A few more are worth mentioning such as earnings per share, shown in Figure 3, and dividend growth with the latter focusing on the company’s ability to pay dividends and how much they are growing over time. This is a good indication that a company values its shareholders and is still making enough money to pay out some of it and grow further.
Figure 3
Finding economic data
When it comes to finding economic data across different markets, there are plenty of sources including CFI’s own economic calendar which covers the most economically-focused countries in the world. Beyond our website, a quick google search will help you find different sources with plenty of current and historical data.
On the other hand, data related to companies can also be found around the web by doing quick searches yet not all ratios can be found readily. Some of them may need to be calculated manually but the process is usually easy and straightforward.
Publicly traded companies usually include much of their data in periodic reports or on their website while other portals and sources should have those numbers along with comparisons against peers and within sectors readily available for readers and viewers. Some services may be paid and could provide added value such as analyst coverage or more advanced and in-depth analysis.
Conclusion
It’s important to remember that fundamental analysis is not concrete nor an easy way to predict the direction of an asset or market. In fact, putting together all the numbers and ratios could create conflicting perspectives which means that traders need to keep their risk tolerance in mind while watching the price behavior of that asset.
At times, large releases may create enough of a shock to reverse an entire trend and wipe out gains or losses seen for a long period of time. Traders need to keep an eye on historic figures as well as new ones that could hint at potential seismic changes.
Another point to keep in mind is the importance of integrating technical analysis within your fundamental strategy. Even the most basic forms of technical analysis could help traders develop an edge if they have the direction right and could save them from unnecessary drawdowns if they enter too early or too late.
Technical analysis will help you look for corrections in a fundamentally confirmed uptrend or downtrend and will help traders better understand the current cycle of a product.
Disclaimer: The content published above has been prepared by CFI for informational purposes only and should not be considered as investment advice. Any view expressed does not constitute a personal recommendation or solicitation to buy or sell. The information provided does not have regard to the specific investment objectives, financial situation, and needs of any specific person who may receive it, and is not held out as independent investment research and may have been acted upon by persons connected with CFI. Market data is derived from independent sources believed to be reliable, however, CFI makes no guarantee of its accuracy or completeness, and accepts no responsibility for any consequence of its use by recipients.


