CFDs are leveraged products that incur a high level of risk. Know more

- Accounts
 Trading DetailsCFI AIHelp & Support
What is Technical Analysis
Basic technical signals for trading
August 15, 2024

It’s true when they say the financial markets never sleep. That’s because the markets are open 24 hours a day, 5 days a week, and are constantly moving, sometimes in a tight range and other times in explosive moves.
Most assets take trends, which will ultimately dictate the price direction. These instruments will start heading in a specific direction, interrupted by short periods of consolidations or corrections. At the same time, those consolidations can turn into long-term-ranging conditions. Statistically speaking, consolidations are more common than trends and may not be so easy to trade given that they could trick traders into thinking a breakout in a new direction is taking place.
Trading the trend is something that most traders and investors will attempt to do at some point in their trading journeys. A clear uptrend or downtrend takes out the work of figuring out which way an instrument may continue heading. However, traders must also focus on managing their risk and entering the market at the right point.
There are a few indicators that can help traders gauge momentum and direction of instruments. This is turn can allow them to make better decisions when establishing trends.
Moving Averages
Starting moving averages (Figure 1), this is a technical tool that smooths data by creating a constant price average that is updated dynamically on the chart. The average will depend on the period of calculation. For example, a 20 period moving average will reflect 20 hours on a 1-hour chart while a 30 period moving average on a weekly chart will reflect 30 weeks.
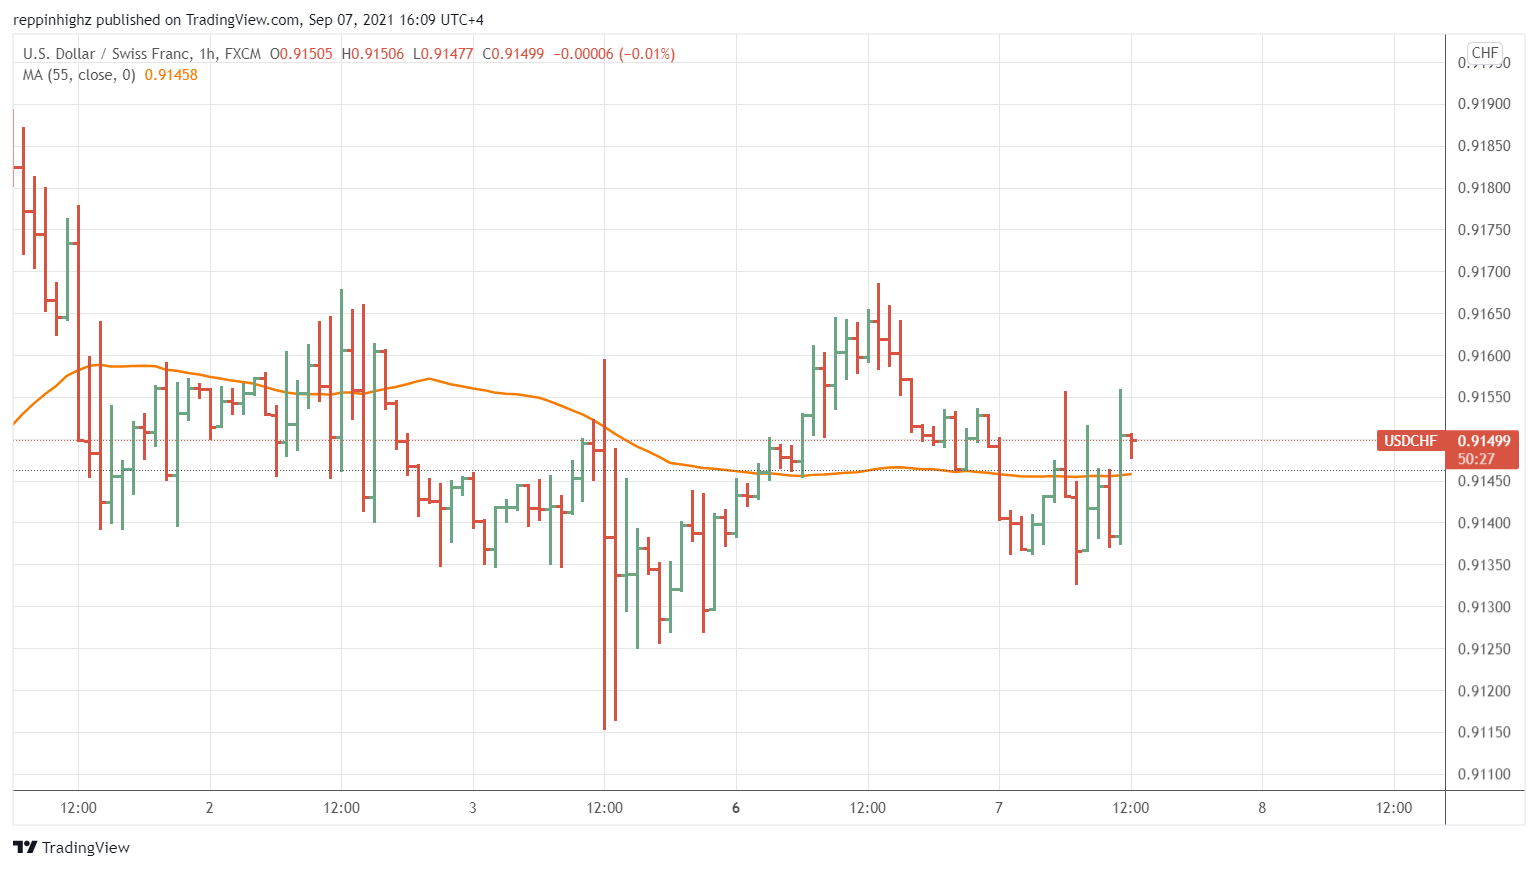
Figure 1: 1-hour USDCHF with 55 period moving average chart
There are different ways to use moving averages for your overall chart analysis. The angle of a moving average will tell you a lot about recent price action. If a moving average is angled up and the price is consistently above it, this tells you that an uptrend is in place with strong momentum. A moving average that is flat and the price is hovering around it would indicate ranging conditions and a sign for traders to stay out until a clearer direction forms.
Moving averages do not predict the future but simply filter out the noise and could give some guidance into the current state of the asset. Based on other studies and historical data, a trader could develop an opinion on how long a trend will last.
Crossovers refer to one moving average crossing the other. For example, if we are looking at two moving averages, a 50 period and a 200 period, then we will see that they will alternate and occasionally cross. If the 50 crosses the 200 in an upward direction, this could indicate a shift in short-term momentum and sentiment and could mean price action in the short term is turning more positive compared to the long term. Some people may look at this as a buy signal although this may not be the best approach as moving averages are lagging by nature.
Moving averages can also serve as dynamic support or resistance levels with price stopping when it reaches them. This is further confirmed by finding price patterns that coincide with the same direction of the support or resistance levels.
Moving Average Convergence Divergence (MACD)
The Moving Average Convergence Divergence, abbreviated as MACD is an oscillator but also serves to highlight a potential trend and momentum. The MACD (Figure 2) is made up of two moving averages and a histogram which is the difference between both.
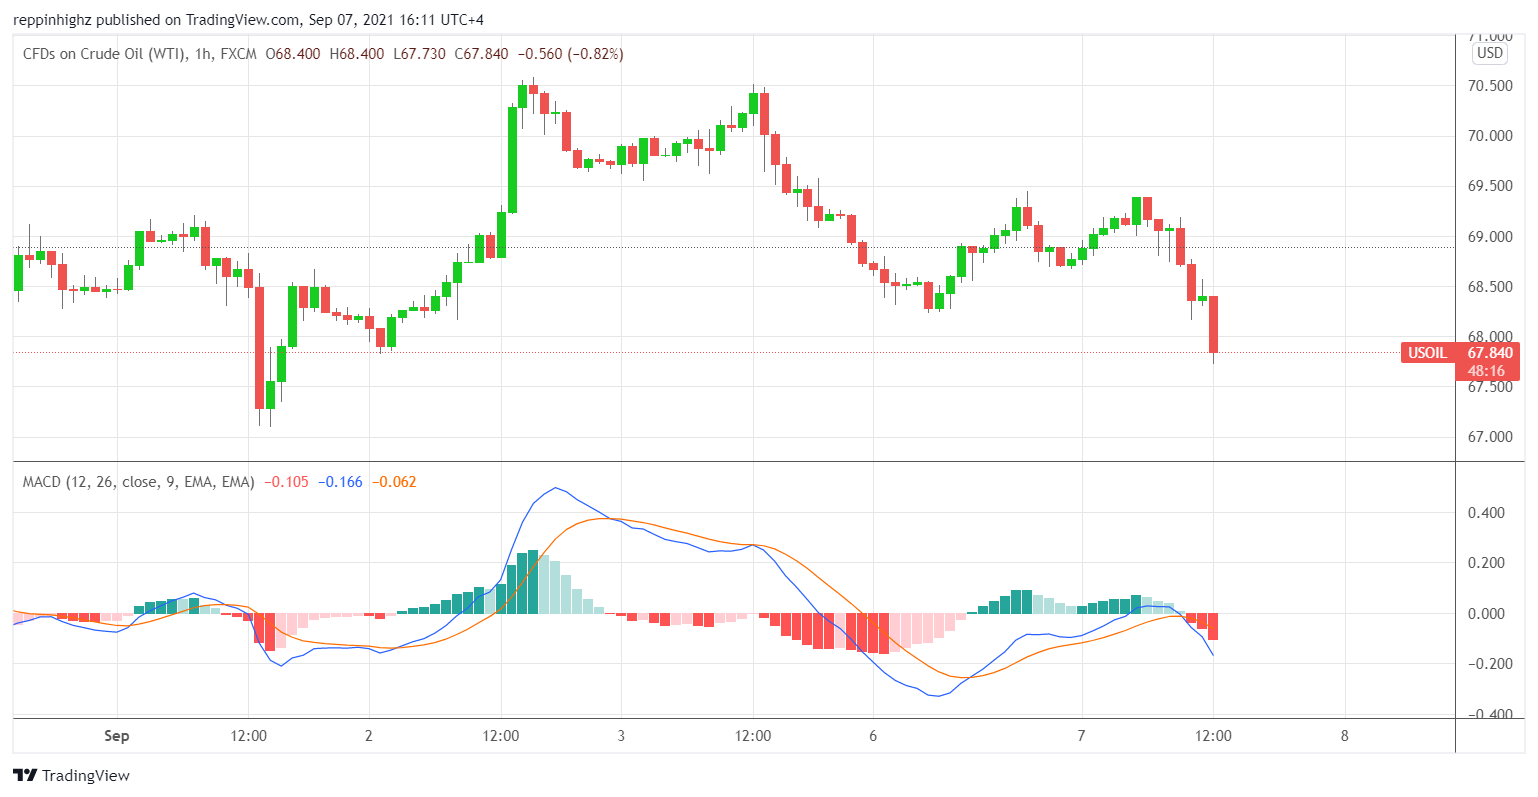
Figure 2: 1-hour EURJPY with MACD chart
One way to trade the MACD is by analyzing whether the lines are above or below zero for a sustained period of time. Consistently positive lines above zero, if supported by upward price action could indicate a clear uptrend currently in place, with the opposite also being true. A good starting point to this strategy is looking for the lines to cross from negative to positive territory, which could indicate that momentum is shifting to the upside. The same is true when the lines cross from positive to negative, showing that weakness may be setting in.
Another signal to look for, and one that is seen as an early warning, focuses on the crossover of the two lines. A positive cross could take place while both lines are in negative territory. This could indicate that downside momentum is fading despite the overall bearish positioning of the indicator. Once again, the opposite is also true.
Analyzing the different signals of the MACD may not lead the way to riches but, if the different ones are taken into consideration alongside the price action associated, it could lead to a better trading performance. This is because the MACD indicator can be seen as a full trading strategy when used properly.
Relative Strength Index (RSI)
The Relative Strength Index (Figure 3), also known as RSI, is one of the most popular and widely used indicators among traders globally. It’s an oscillator that moves between 0 and 100 and is used as an overbought and oversold indicator, given its sensitivity. While this is not the most accurate method of picking tops or bottoms, an RSI reading above 70 is seen as overextended, where price may be due for a correction. The same applies when RSI dips below 30. The closer the RSI reading comes to 0 or 100, the more stretched price is, making the instrument due for a reversal.
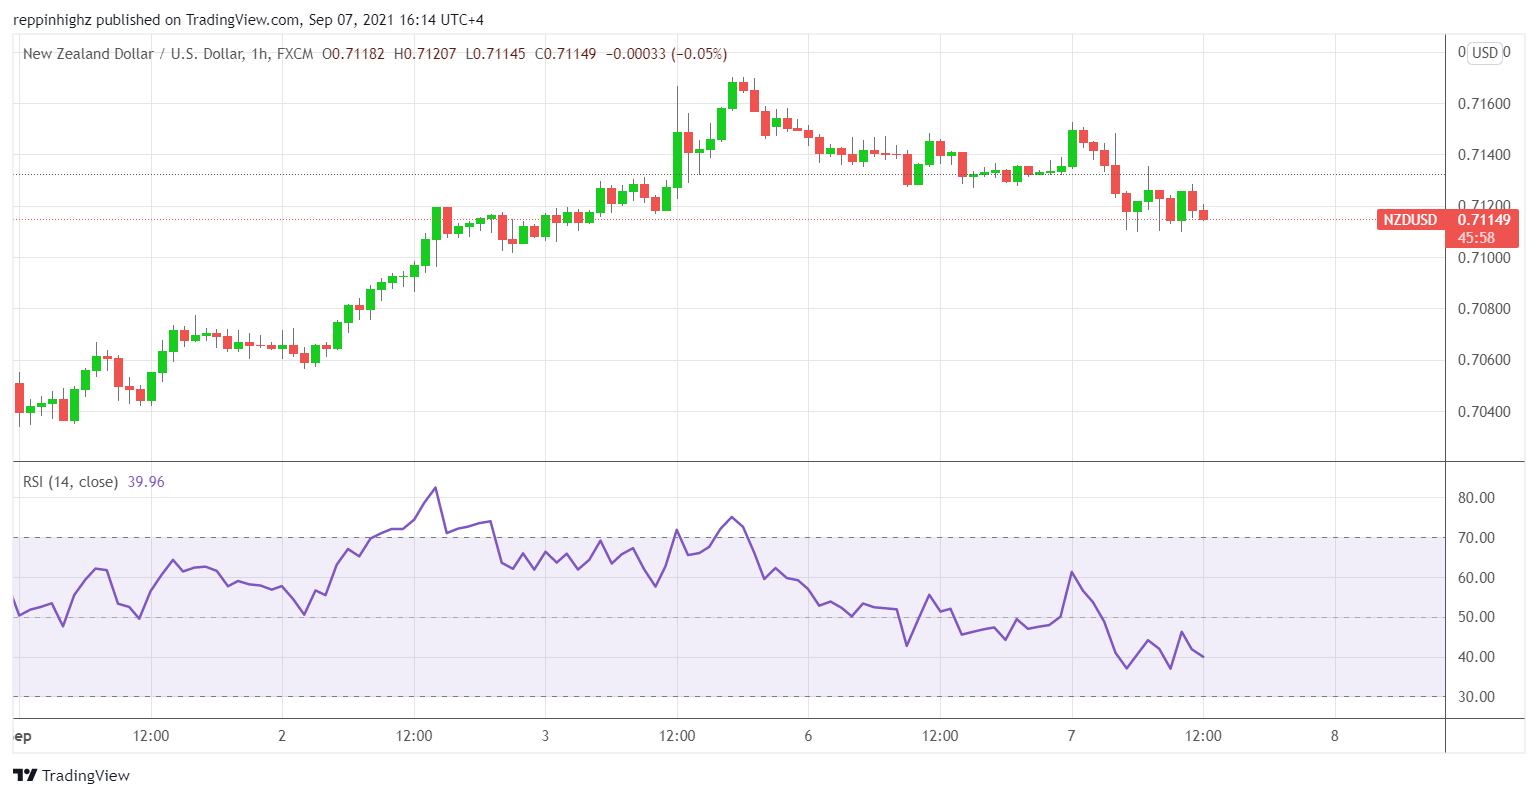
Figure 3: 1-hour NZDUSD with RSI chart
Another major use for the RSI is whether it is above or below the 50 line, an indicator of where momentum is at the moment. Sustained readings above 50 are seen as positive especially if corrections are minor and the indicator itself is hitting 60-70 frequently. The same is true when the indicator is below 50 and often reaching 30-40 with minimal corrections.
In line with the 50 line, an uptrend will see RSI failing to dip below 40 and constantly reaching above 60 towards the 80 level. Effectively, a new range forms between 40 and 80, and depending on how strong the uptrend is, the indicator could find support at 50 and may reach 90 at times.
On the other hand, a downtrend will see the RSI ranging between 20 and 60 where 60 acts as resistance and 20 as weak support in a downtrend. Depending on how bearish the trend is, the indicator may find resistance at 50, providing an area for traders to short a certain asset.
Again, it’s all about watching price action and not just indicators. When patterns are studied, they could help traders create more consistency in their trading.
Bollinger Bands
Bollinger Bands (Figure 4) are a great tool that visually shows the volatility of an instrument. In its default setting, Bollinger Bands are set at a 20-period setting which reflects 20 days if placed on a daily chart. Aside from the main line, they are made up of 2 standard deviations: a +2 and a -2. Price typically moves within the bands and as volatility picks up, the bands widen and the range expands, regardless of whether a trend is already in place or not.
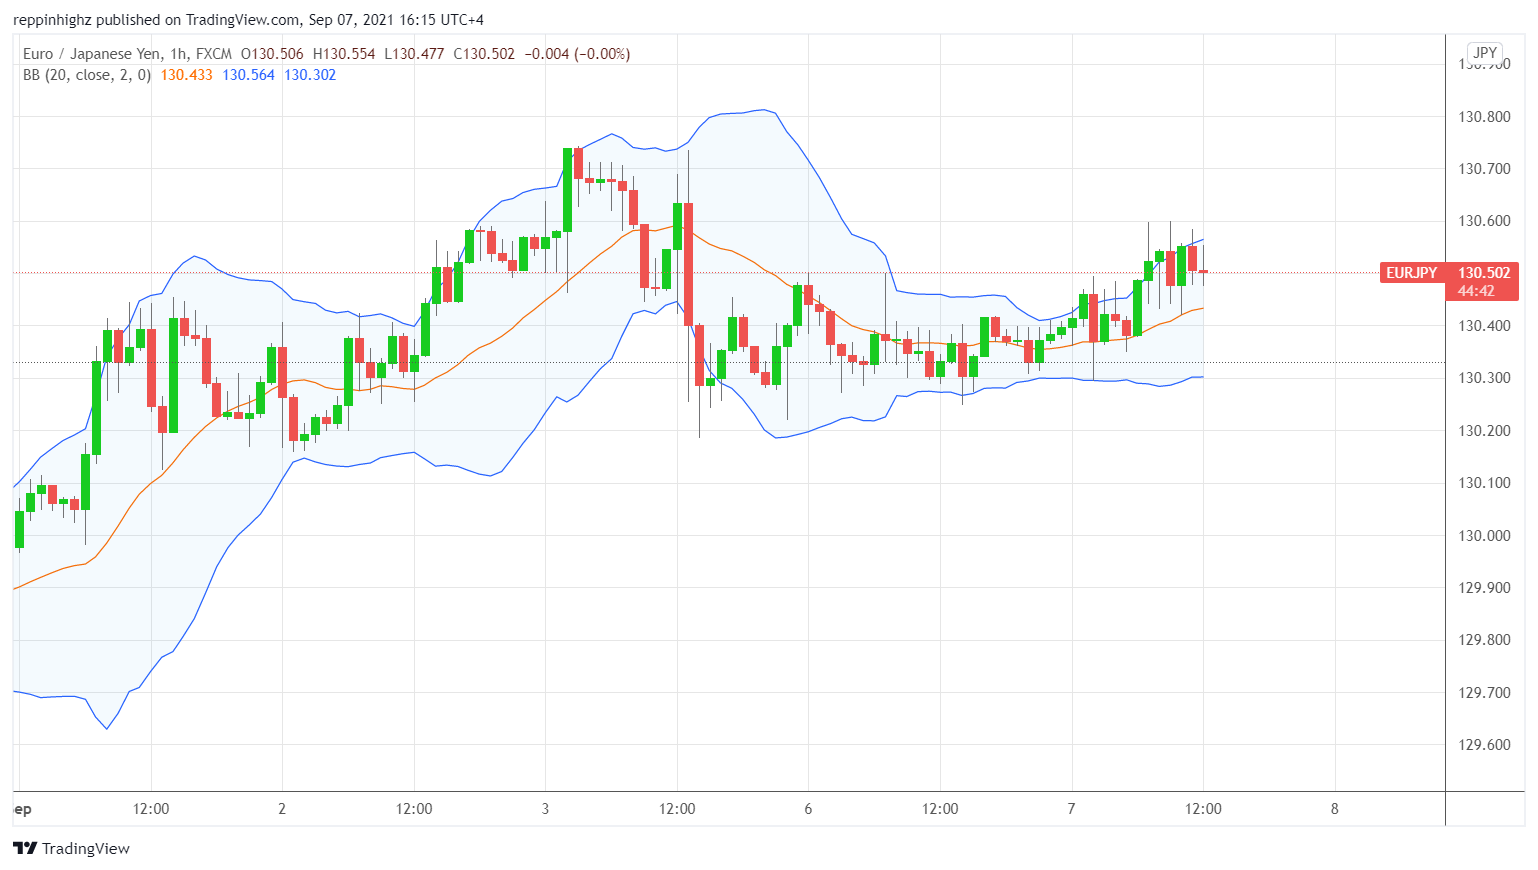
Figure 4: 1-hour EURJPY with Bollinger Bands chart
At times, sudden volatility may strike a certain asset with the price exiting the outer bands of the indicator. In this case, a mean reversal is likely and could take place immediately or at least, lead to a period of consolidation as the balance of the asset has been thrown off.
Bollinger Bands can help traders understand how an asset moves on a daily basis. With enough chart watching, traders can pinpoint when volatility is above average and even at extreme levels.
Stochastic Oscillator
The stochastic oscillator (Figure 5) is another indicator that hovers between 0 and 100 and depending on the period, may help trades find short-term reversals.
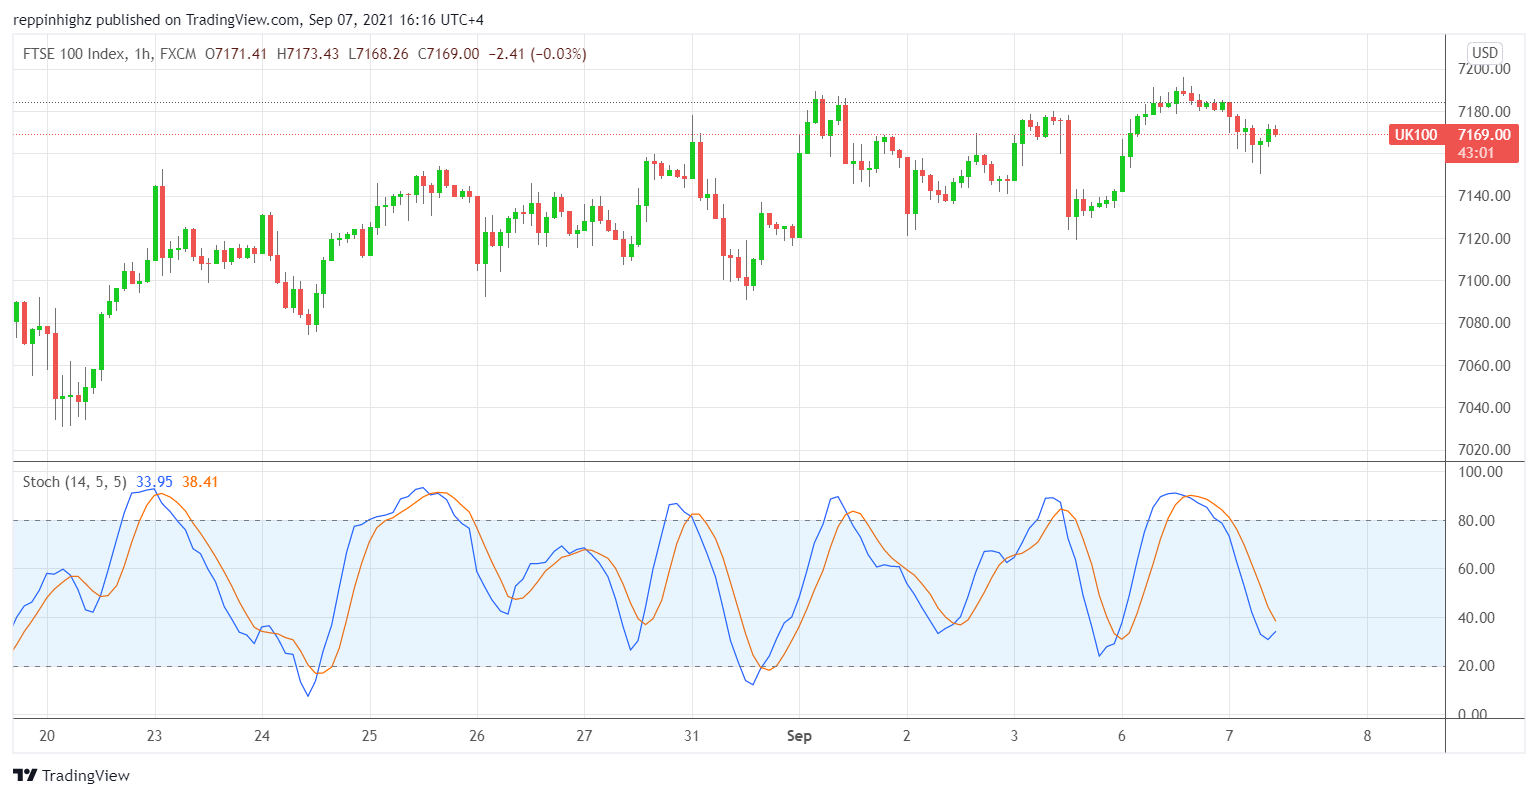
Figure 5 – 1-hour FTSE 100 with Stochastic chart
Stochastics work well with other indicators especially if a trend is already established. They could help pinpoint entries within corrections during uptrends or downtrends. Also, when a financial instrument is consolidating, the stochastic oscillator could help traders pinpoint the top and bottom parts of the range.
It's important to keep in mind the behavior of price in relation to indicators. Momentum may change and could be seen in indicators. But if price action is not supportive or if a reversal is quickly stopped by minor support or resistance, then a bigger move is not likely.
Putting it all together
Indicators are a great way of visualizing price. Some of them may be lagging while others could lead the way, especially when it comes to momentum. There are several elements to focus on when considering indicators as part of your trading plan:
Price action
This is a given as price is more important than anything else. Initially, it’s important to establish if the price is trending or ranging. The next step would be to define your levels and the final step would be to use indicators as extra confirmation around those levels. It’s not so much about the order as it is about the importance of making sure you have a specific outlook and the price action makes sense.
Timeframe
Bigger timeframes are usually more noise-free and could be precursors to big and profitable moves. Applying the above plan on a bigger timeframe means better efficiency as traders would spend less time analyzing and executing. Unless you are a day trader or someone who has the time to focus on quick intraday trades, bigger timeframes should be the go to setting for any trader or investor who is already preoccupied with other aspects of life. Also, indicators tend to be smoother to look at and understand on higher timeframes especially beyond the hourly charts.
Economic releases
With price and strategy in mind, it’s important to keep an eye on economic releases or any events that could disrupt the current flow of the market. While some events are unpredictable and create sudden and explosive volatility, the ones that are scheduled and known to affect the markets such as employment data, GDP figures, or central bank events can be expected and planned for in advance.
Final thoughts
When it comes to indicators, there is no right or wrong in terms of the choice of indicators for your strategy. In other words, it’s about what you prefer and feel comfortable with while finding something that adds value to your strategy. It is all about how they are used and applied. Indicators are great tools that can help you spot patterns and better understand the behavior of certain instruments which eventually could create a habit of reading financial products. Nonetheless, they have to be taken with a grain of salt. Other factors are just as important, such as price itself or expected events that could affect the market. Also, indicators may be prone to noise movements on smaller timeframes and could lead to more false signals and expectations in comparison with bigger timeframes, where moves are larger and price action is cleaner.
Disclaimer: The content published above has been prepared by CFI for informational purposes only and should not be considered as investment advice. Any view expressed does not constitute a personal recommendation or solicitation to buy or sell. The information provided does not have regard to the specific investment objectives, financial situation, and needs of any specific person who may receive it, and is not held out as independent investment research and may have been acted upon by persons connected with CFI. Market data is derived from independent sources believed to be reliable, however, CFI makes no guarantee of its accuracy or completeness, and accepts no responsibility for any consequence of its use by recipients.
Related Articles
See All


