CFDs are leveraged products that incur a high level of risk. Know more

- Accounts
 Trading DetailsCFI AIHelp & Support
What is Technical Analysis
Multiple time frame analysis
August 15, 2024

Introduction
Prices move in different cycles, whether long term, medium-term, or even short-term. These cycles reflect the long-term, medium-term, and short-term trading signals, as shown in Figure 1.
Figure 1
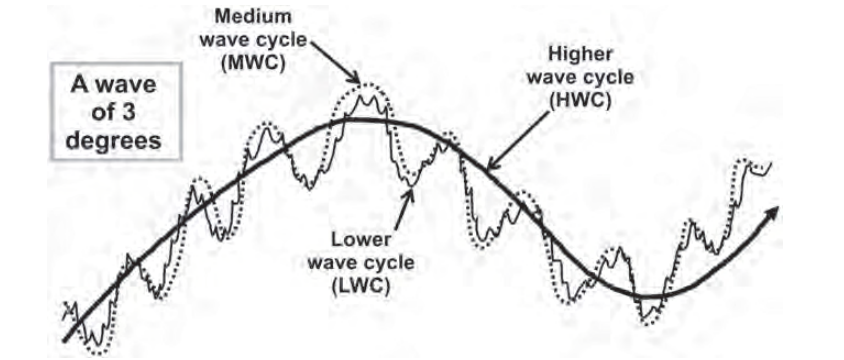
The medium wave cycle (MWC) and lower wave cycle (LWC) are both sub-waves of the higher wave cycle (HWC), and are regarded as wave cycles of lower degrees. A trader must be able to visualize price cycles on the chart. Without knowing which wave cycle is being traded, any of the following scenarios may result:
- Inability to select consistent breakout levels
- Inability to select effective stop-loss levels
- Inability to apply effective stop sizing
- Inability to distinguish between trend and consolidation mode
- Inability to determine the direction of the predominant trend
What is a multiple time frame analysis?
Multiple time periods allow the trader to time their entries into the market using very short-term data while watching the longer-term picture for the daily or weekly trend. Because it is agreed that most trends are best identified over a longer period, and choosing the specific entry point requires a much faster response, the combination of two or even three-time intervals is very sensible when each one targets a specific purpose.
If the trend can be identified profitably, then the trader can filter or select short-term trades that have a better-than-average chance of becoming winners.
How to use a multiple time frame analysis
Step 1: Identify the main time frame. This time frame is dependable on the trader’s lifestyle and when he can watch the market, such as the 4-hour chart.
Step 2: Identify the higher time frame. This determines the higher cycle trend, such as the daily chart.
Step 3: Identify a shorter timeframe for entries. This could be the 1-hour or 30-minute chart.
A trader can choose two timeframes: Higher timeframe for trend analysis and lower timeframe for execution. The relation between every time frame of the cycle is 4 to 6.
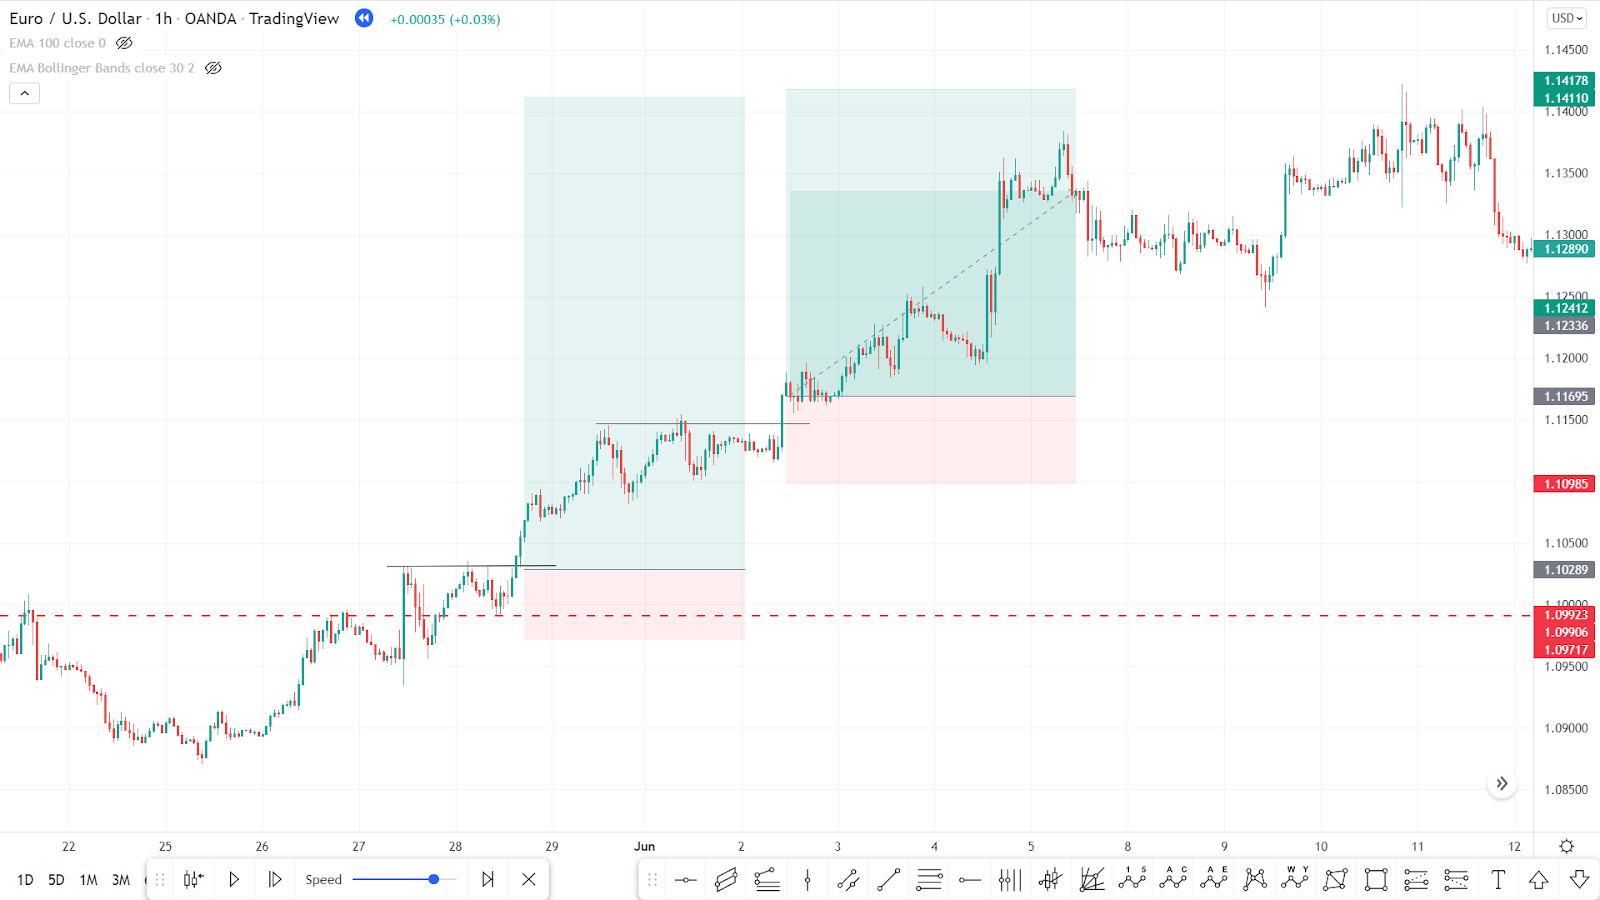
EURUSD daily and 1H chart example
EURUSD in the daily chart breaks out through horizontal resistance and begin an upward trend, as shown in Figure 2. Traders should use a 1-hour chart for timing the entry-level with smaller stop loss, as shown in Figure 3.
Figure 2
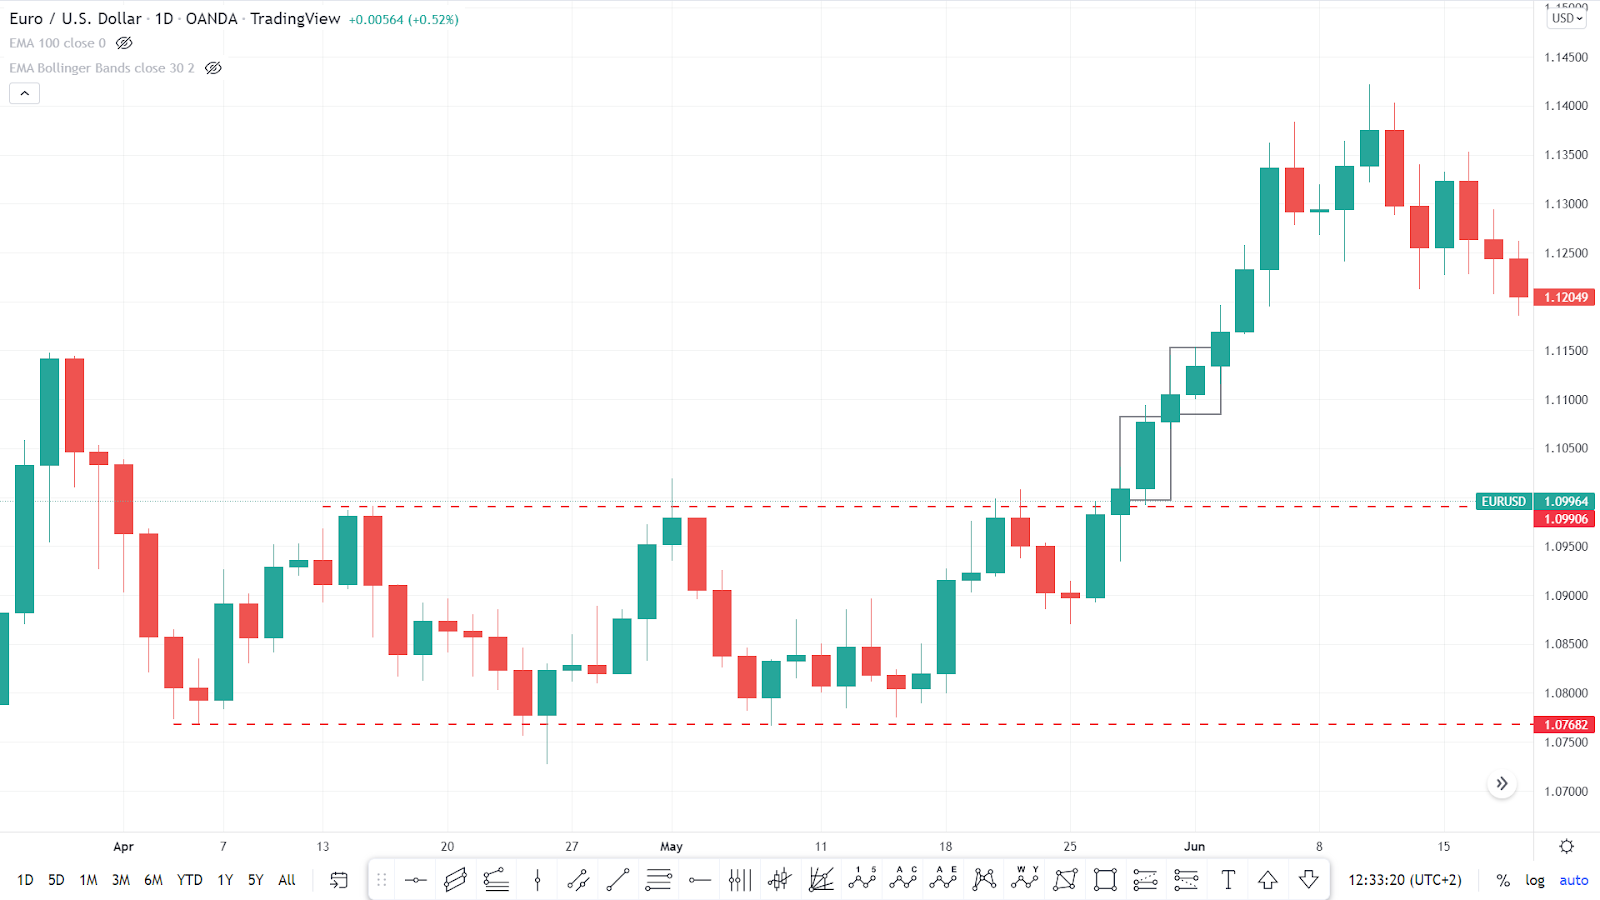
Figure 3
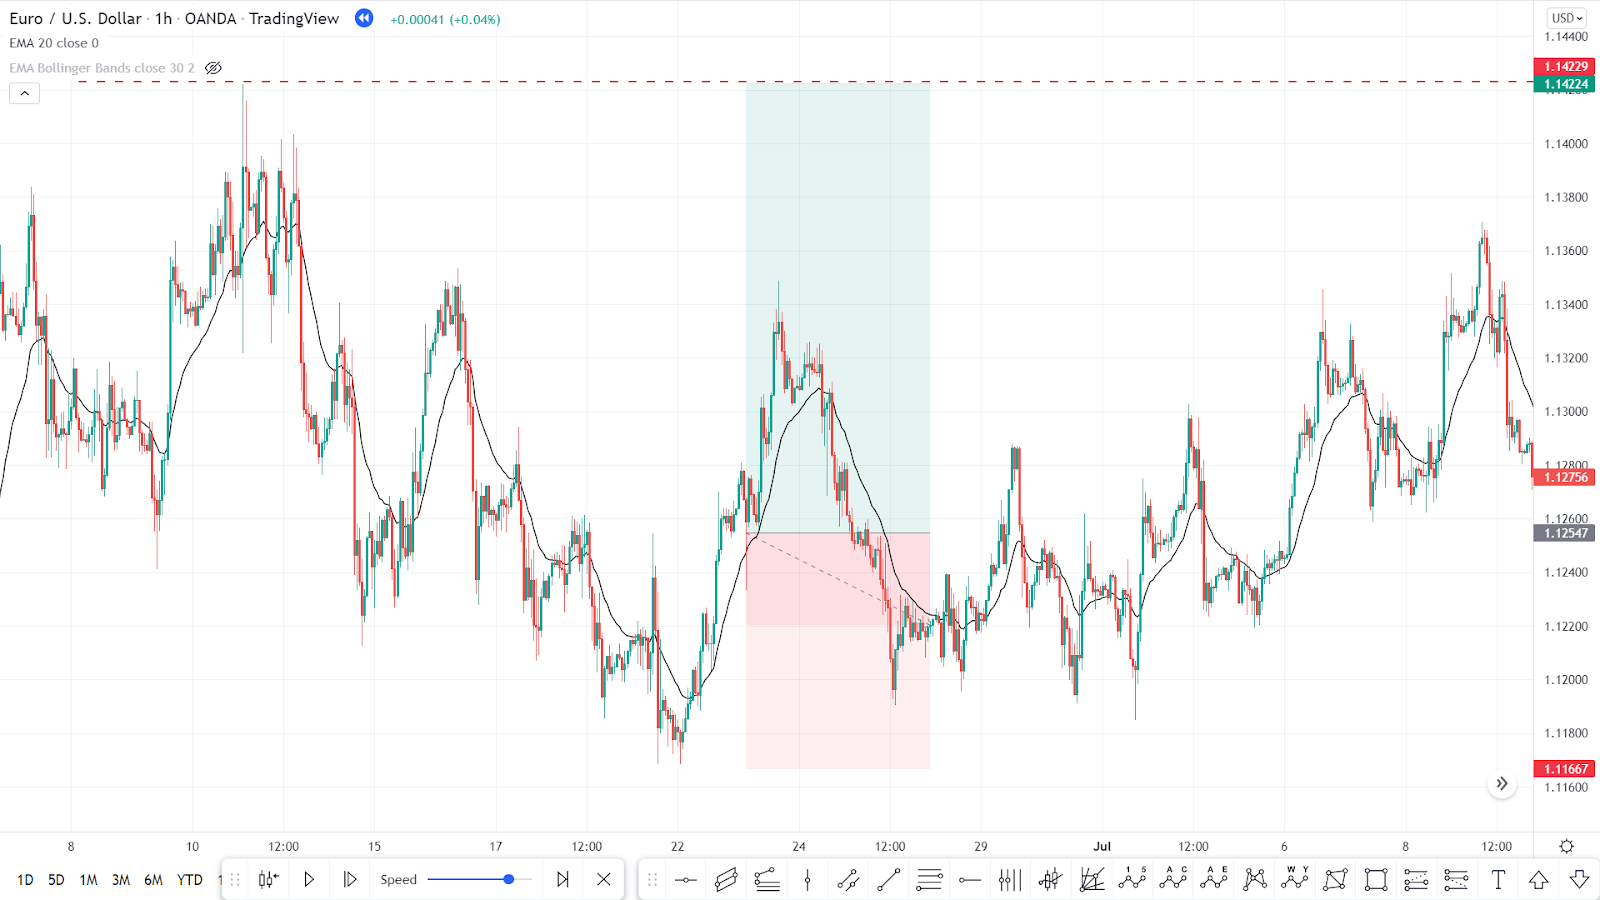
Now, assume EURUSD in the daily chart moved in an uptrend, then bounced down around level 1.1425 and began a short-term correction toward EMA 20, as shown in Figure 4. EURUSD in the 1-hour chart moves in a downtrend, so traders should wait for a reversal for entry, as shown in Figure 5.
Figure 4
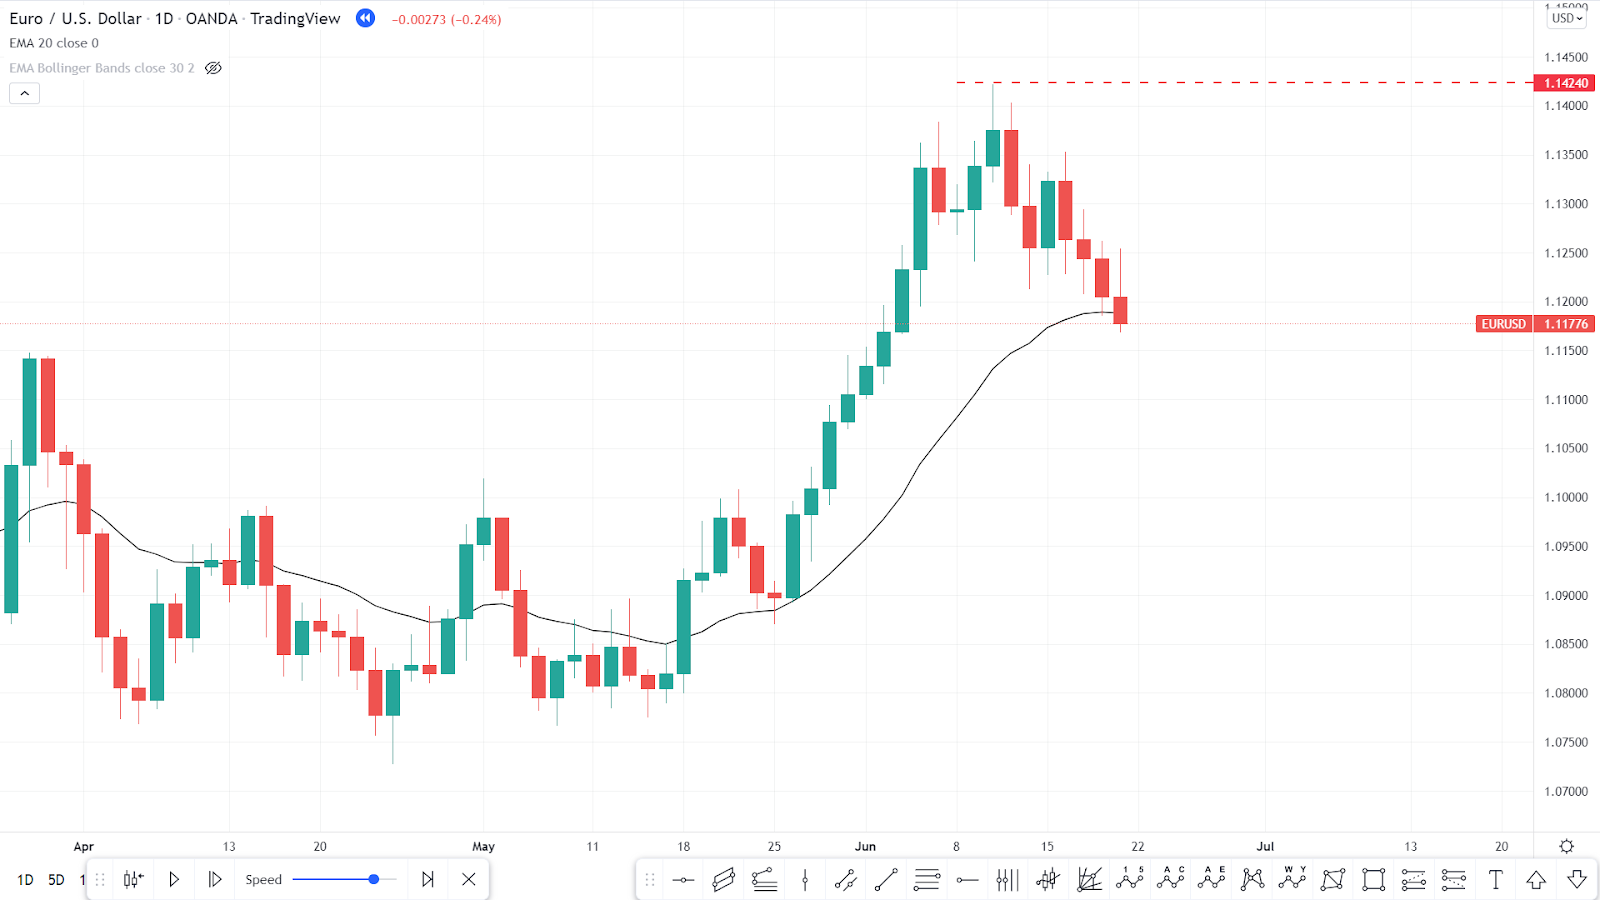
Figure 5
GBPUSD daily and 1H chart example
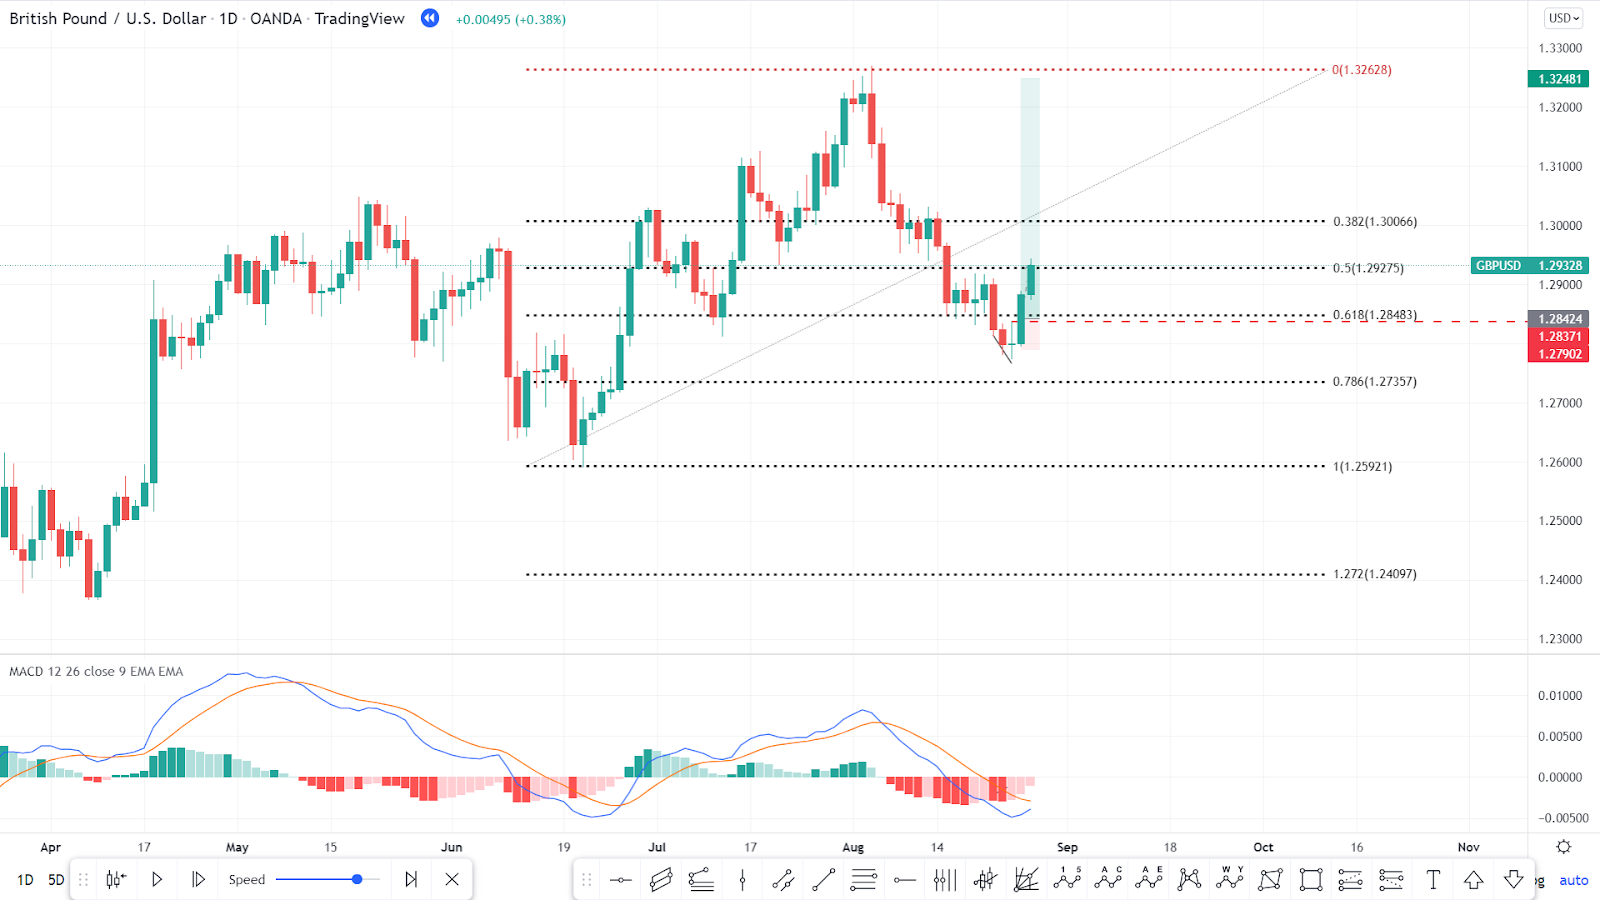
GBPUSD in daily chart moves in an uptrend then bounced down to correct, and it is now trading around 61.8% Fibonacci retracement as shown in Figure 6.
Figure 6
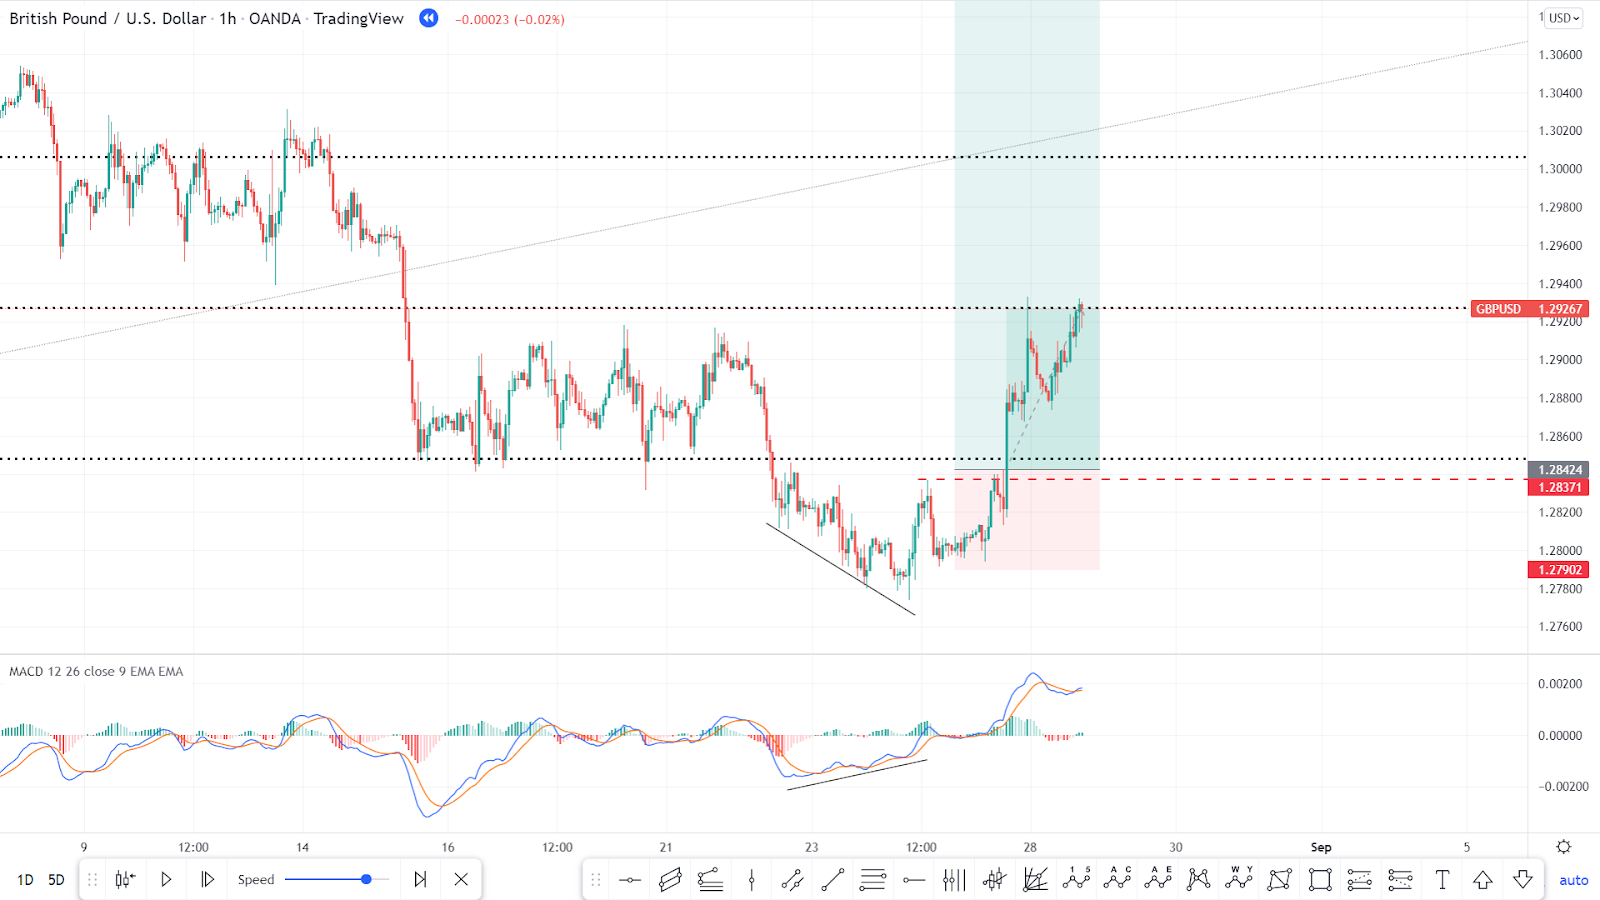
GBPUSD in the hourly chart moves in a downtrend, and when the trend reverses to an uptrend, that will be the entry-level, as shown in Figure 7.
Figure 7
Elder’s triple-screen trading system
It combines trend-following and oscillators using three-time frames, each serving a specific purpose. The oscillators are normally associated with timing, while the trend determines the direction of the trade.
Dr. Elder has observed that each time frame relates to the next by a factor of five. That is, if you are using daily data as the middle time period, then the shorter interval will be divided into five parts, bars of 1 to 2 hours in length, and the longer period will be five days or one week
Screen 1: The major move (lowest frequency data)
The long-term view is used to see the market tide, a clear perspective of the major market trend, or sometimes the lack of trend. Weekly or daily data is used. The triple screen approach uses the slope of the weekly MACD, where the histogram that represents the MACD value is very smooth, equivalent to, for example, a 13-week exponential.
The trend is up when the MACD bar, or 13-week exponential value, is higher than the previous week; the trend is down when this week’s value is lower.
Screen 2: The intermediate move (middle-frequency data)
The oscillator applied in screen 2 (the second panel) identifies the period in which we would trade. Again, the specific oscillator is not as important as the time frame and the ability to identify market waves in the major moves of Screen 1. A stochastic can also be used.
Screen 3: Timing (high-frequency data)
The final screen is for the fastest response, primarily identifying intraday breakouts. a new buy signal occurs when the high of the hourly bar moves above the highest high of the hourly bars of the previous day
Elder’s example
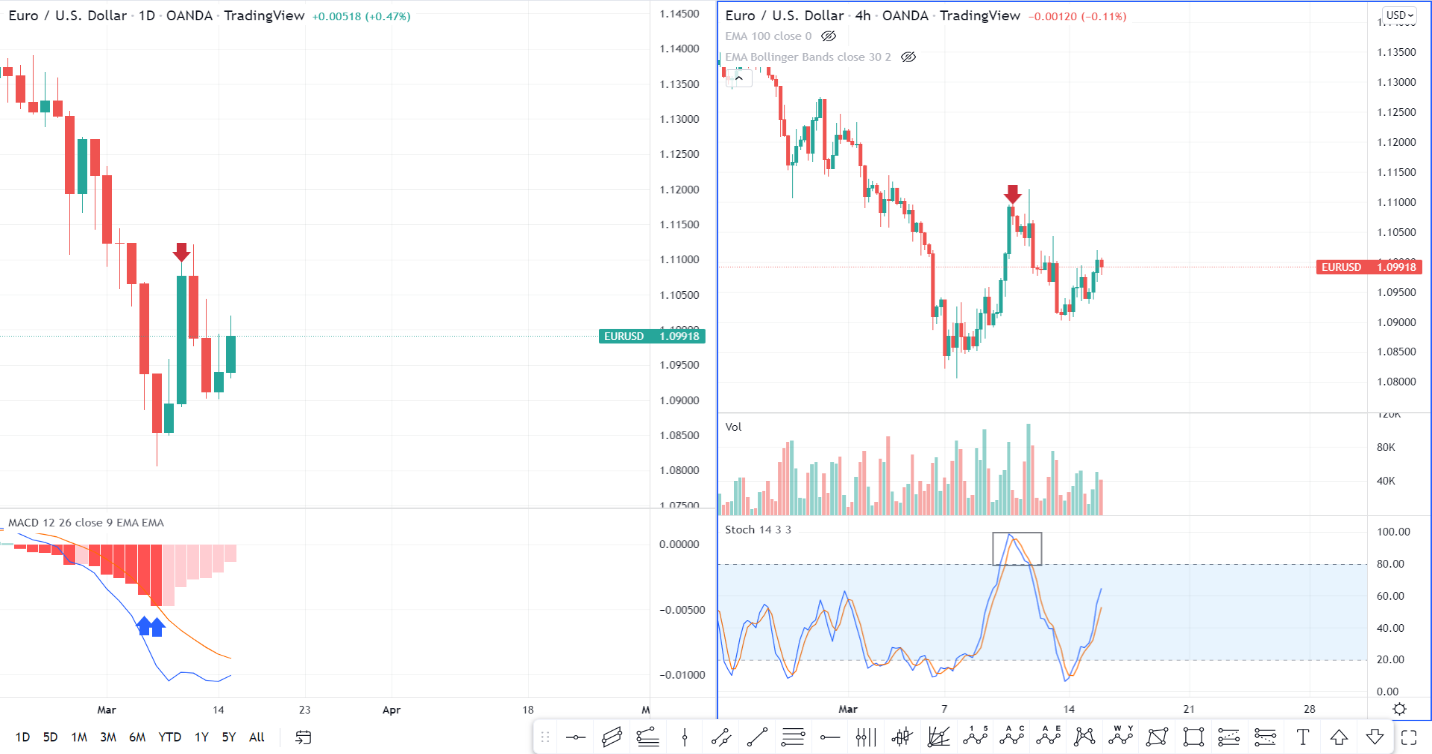
Screen 1: Daily chart with MACD histogram shows a downtrend.
Screen 2: 4-hour chart with stochastics in the overbought area shows a good time for the sell signal, as shown in Figure 8.
Figure 8
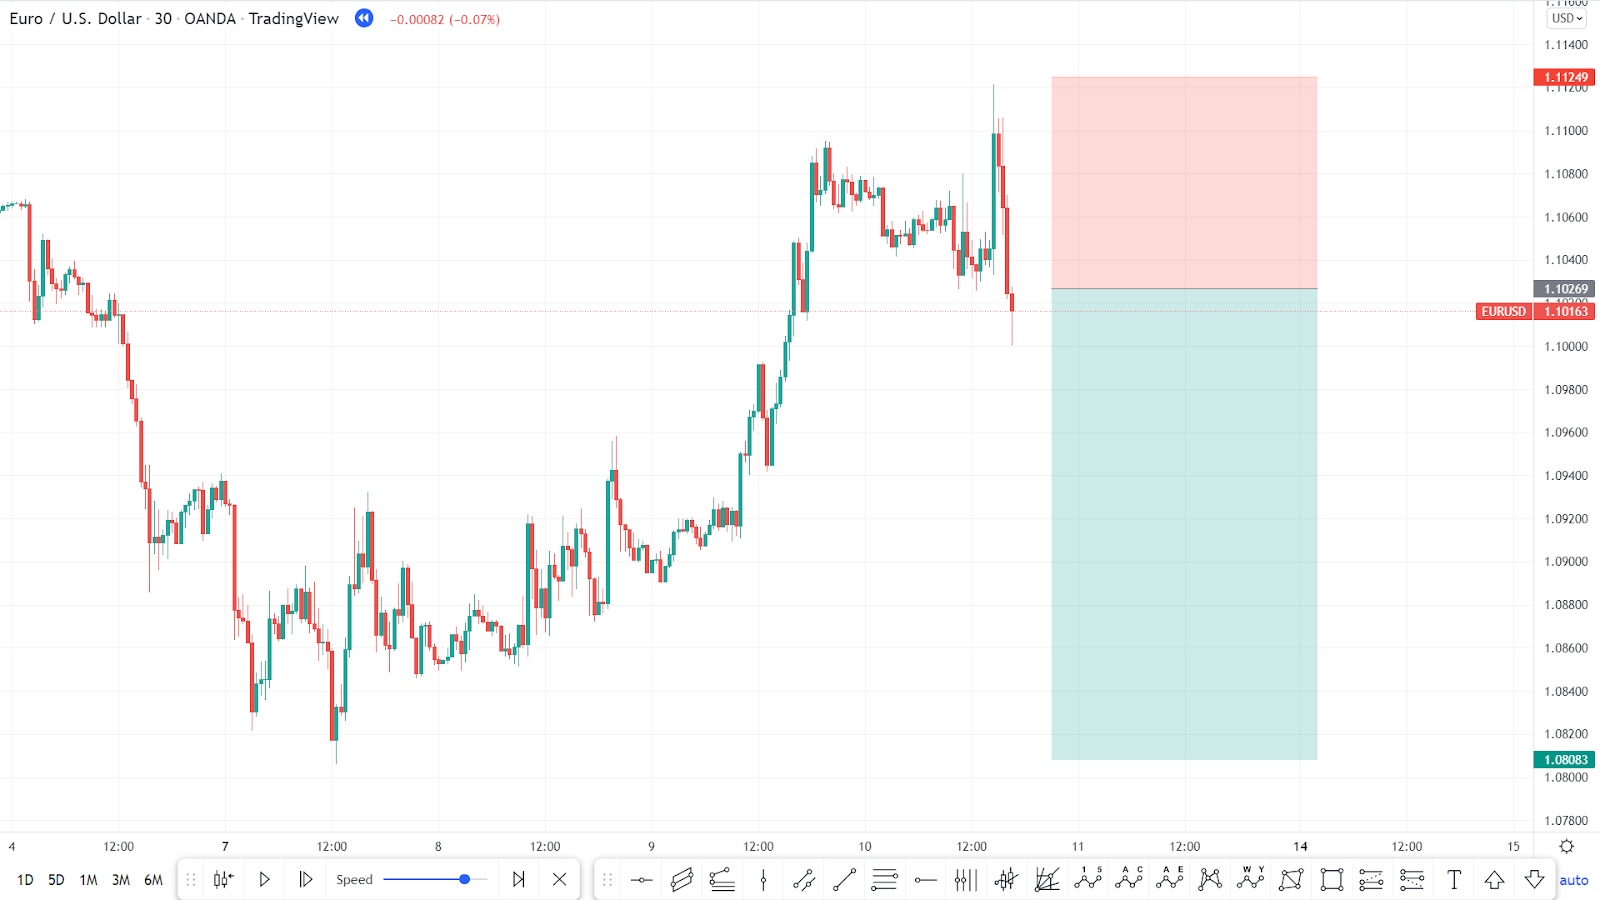
Screen 3: 30-minute chart shows a breakdown entry with stop loss above the high, as shown in Figure 9.
Figure 9
Conclusion
Using multiple time-frame analyses can drastically improve the odds of making a successful trade and improve the risk to reward ratio by taking entries and stop loss in lower time frames and targets with higher time frames.
Disclaimer: The content published above has been prepared by CFI for informational purposes only and should not be considered as investment advice. Any view expressed does not constitute a personal recommendation or solicitation to buy or sell. The information provided does not have regard to the specific investment objectives, financial situation, and needs of any specific person who may receive it, and is not held out as independent investment research and may have been acted upon by persons connected with CFI. Market data is derived from independent sources believed to be reliable, however, CFI makes no guarantee of its accuracy or completeness, and accepts no responsibility for any consequence of its use by recipients.
Related Articles
See All


