
- Investing
 SpecialsAccountsTrading DetailsCFI AIHelp & SupportPartnership
What is a recession and how to identify one?

The National Bureau of Economic Research’s (NBER) Business Cycle Dating Committee says a recession occurs if there is a trough in the business cycle that is characterized by a negative gross domestic product (GDP) that’s accompanied by a general decline in the country’s economic activity and output, such as high unemployment rates, contracting income, decreasing retail sales, and declining industrial production for two consecutive quarters.
Recessions are inevitable, being part of the business cycle where economies undergo different stages, starting with expansion, reaching a peak, then declining (recession) till reaching a bottom, and then the cycle starts over.
Several factors determine whether a recession turns into a serious and protracted depression, including the volume and quality of credit provided during the preceding era of prosperity, the level of speculation, fiscal and monetary policy, and the quantity of unutilized productive capacity.
A depression in economics is a prolonged severe form of recession that can persist for years. An example of a depression is the 1929 Great Depression when GDP declined by 30%, industrial production fell by around 50%, and unemployment surpassed 20% from 1929-1933.
Bonds and recessions
The bond market plays a key role in identifying a recession. To be precise, the inversion of the yield curve is a key harbinger of recessions. It has accurately predicted the last 10 recessions. Downturns are not brought on by the yield curve; instead, it shows the course that investors believe the economy will take.
If investors see an imminent slump in the economy, they will turn to buy long-term treasuries. Investors will hurry to purchase long-term bonds if they think a downturn is soon to come to lock in their returns.
As demand increases for long-term treasuries in a short time, their yield decreases, and vice versa with short-term treasuries. Therefore, during a recession, as the maturity increases, the yield decreases. When the short-term bonds have higher yields than those of the long-term bonds, the yield curve inverts and slides downward.
Factors that cause recessions
Common root causes of recessions are oversupply, speculation, and uncertainty. The oversupply happens during an economic boom when businesses typically boost output to keep up with demand from customers.
The surplus of goods and services that aren't used when demand peaks can cause a recession, in which businesses reduce production and lay off workers as consumer purchasing power declines. Another main factor is a sharp increase in inflation causes a sharp decline in aggregate demand, and to counter the inflationary pressure, a central bank would adopt a tightening policy.
With a sharp sudden rise in a specific asset due to consumer speculations, investors start selling their assets hoping to earn a return from the increase in prices; thus, supply exceeds demand as fewer buyers are available, driving prices down and causing the bubble to burst.
Many of the recessions that have occurred in the past were due to problems within the financial markets such as the credit bubbles leading to even more prolonged recessions. Such as that of the 2008 financial crisis which occurred because consumers were borrowing excessively during an uncontrolled financial sector collapse.
Uncertainty is another factor that happens due to external shocks such as political turbulence, or pandemics where people halt their investment and consumption, such as thee COVID-19 pandemic.
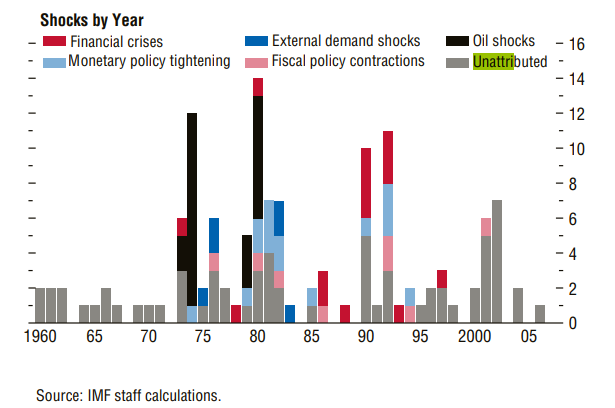
Oil shocks are the most common, while monetary and fiscal policy shocks are the least common, as seen in Figure 1.
Figure 1
Effects of a recession
According to the NBER, there have been 34 recessions in the US since 1857, ranging in duration from two months (February to April 2020) to more than five years (October 1873 to March 1879). The six recessions since 1980 have averaged fewer than 10 months, compared to the average recession duration of 17 months, seen in Figure 2.
Figure 2
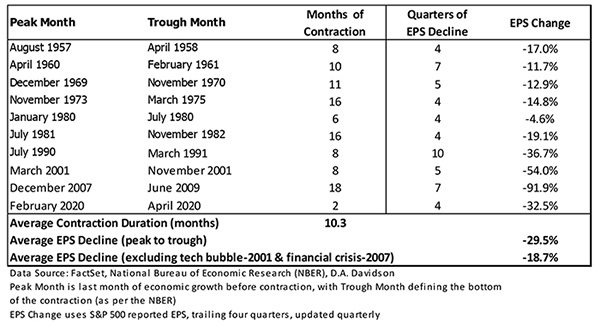
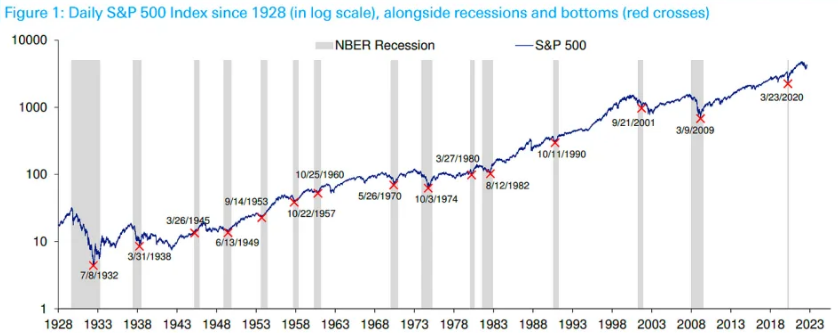
The stock market falls during a recession. Figures 2 and 3 below show the change in real GDP from peak to trough and the percentage change in the S&P 500 peak-to-trough, showing an average of negative 3% and negative 30%, respectively.
The S&P 500 has increased by an average of 1% during all recession periods since 1945 as markets usually top out, meaning that they are at the end of a flourishing period and now can be expected to stay on a plateau.
Figure 3
| Quarter and Peak in Real GDP | Change in real GDP Peak to Trough | S&P500 Peak to trough decline (% change) |
| Q4 1948 | -1.75% | -21% |
| Q2 1953 | -2.5% | -15% |
| Q3 1957 | -3.6% | -21% |
| Q1 1960 | -1.3% | -14% |
| Q3 1970 | -1% | -36% |
| Q4 1973 | -3.1% | -48% |
| Q1 1980 | -2.2% | -17% |
| Q3 1981 | -2.8% | -27% |
| Q3 1990 | -1.3% | -19.9% |
| Q4 2000 | -0.3% | -49% |
| Q4 2007 | -4.2% | -56.8% |
| Q2 2020 | -10.1% | -33.8% |
| Average | -3% | -30% |
Figure 4
Businesses that collapse during a recession might permanently lose their ability to produce goods and services and destroy their productive potential. This is particularly expensive when companies already possess specialized expertise or are an integral element of a supply chain.
Recessions have both social and economic costs. As earnings are adversely affected, companies tend to lay off employees to decrease the high costs associated with the recession. For example, in 2022 as fears of a recession rose, many companies decided to lay off their workers.
Types of recoveries
Various shocks are connected to certain patterns of macroeconomic and financial variables. Recovery shapes relate to the length and complexity of the recession, named based on different letters, such as V, U, W, L and K.
Each recovery type is charted on a graph looking like those letters. A V-shaped recovery signifies that the economy went through a sharp, brief decline then bounced back to normal levels, such as the 1953 recession.
A U-shaped recovery signifies a steady slower recovery of the economy, such as that of the 1973-1975 recession. The W-shaped recovery, or double-dip recession, signifies a double whammy where the economy recovers and then dips into another second recession before it fully recovers back to pre-recession levels, such as that of the 1980s recession. An L-shaped recovery signifies a depression such as that of the 2007-09 crisis. Finally, in a K-shaped recovery, the newest of all, is where the economy experiences two contradictory trends.
The V-shaped and U-shaped recoveries are the most common. The best-case scenario is a V-shaped recovery due to the brief time spent in the recession's trough, whereas the worst-case scenario is an L-shaped recovery due to the lengthiest recovery.
Recession-proof investments
There is no recession-proof recipe; however, there are some investments that guard one’s portfolio in times of economic uncertainty. Gold is commonly known as a haven asset. Defensive stocks are also considered safe havens, where their products have inelastic demand, where consumers will still have to consume them regardless of the economic situation, such as consumer staples, utilities, and health care.
A wise investor will diversify their portfolio by including different types of assets, whether its stocks or fixed-income instruments. Investors may also consider dividend-paying stocks in mature industries.
For example, during the 2008-2009 financial crisis, the S&P 500 index fell by more than 40%, but stocks such as Walmart (WMT) and McDonald’s (MCD) fell by less than 4%. Investors can increase the amount of inflation-protected assets, short-term bonds, and cash to further cushion against market volatility.
Disclaimer: The content published above has been prepared by CFI for informational purposes only and should not be considered as investment advice. Any view expressed does not constitute a personal recommendation or solicitation to buy or sell. The information provided does not have regard to the specific investment objectives, financial situation, and needs of any specific person who may receive it, and is not held out as independent investment research and may have been acted upon by persons connected with CFI. Market data is derived from independent sources believed to be reliable, however, CFI makes no guarantee of its accuracy or completeness, and accepts no responsibility for any consequence of its use by recipients.


