
- Investing
 SpecialsAccountsTrading DetailsCFI AIHelp & SupportPartnership
Fibonacci retracements

Introduction
Leonardo Fibonacci was a mathematician born in 1170 AD. From his work, we get the Fibonacci sequence of numbers and the well-known Fibonacci golden ratio. The Fibonacci sequence is a series of numbers where the next number is the sum of the two preceding numbers. For example, it would run 0, 1, 1, 2, 3, 5, 8, 13, 21, 34, 55, 89, 144, and so on, with the sequence continuing indefinitely.
Fibonacci retracement levels stem from the Fibonacci sequence. They are horizontal lines that indicate where support and resistance are likely to occur. The Fibonacci retracement levels are all derived from the number string noted above.
After the sequence gets going, dividing one number by the next number yields 0.618, or 61.8%. Divide a number by the second number to its right, and the result is 0.382 or 38.2%. All the ratios, except for 50% (since it is not an official Fibonacci number), are based on some mathematical calculation involving this number string.
Understanding how market prices move
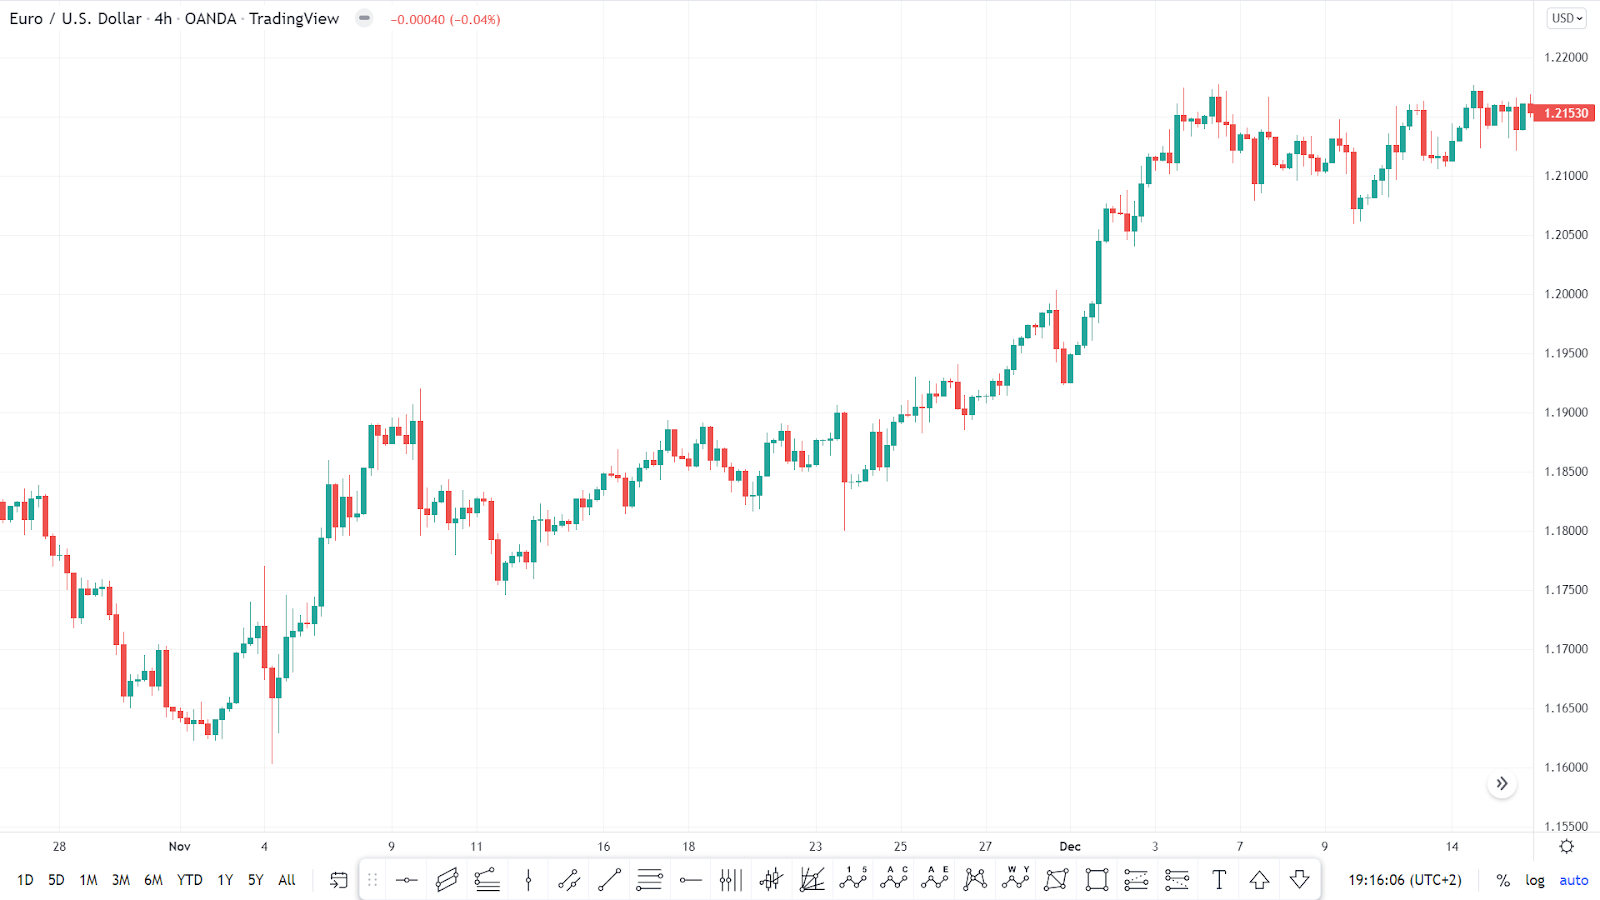
Price does not move in a straight line but instead in a zigzag way. It moves strongly in one direction and corrects some of that movement in the opposite direction, as shown in Figure 1.
Figure 1
Why traders use Fibonacci retracement levels
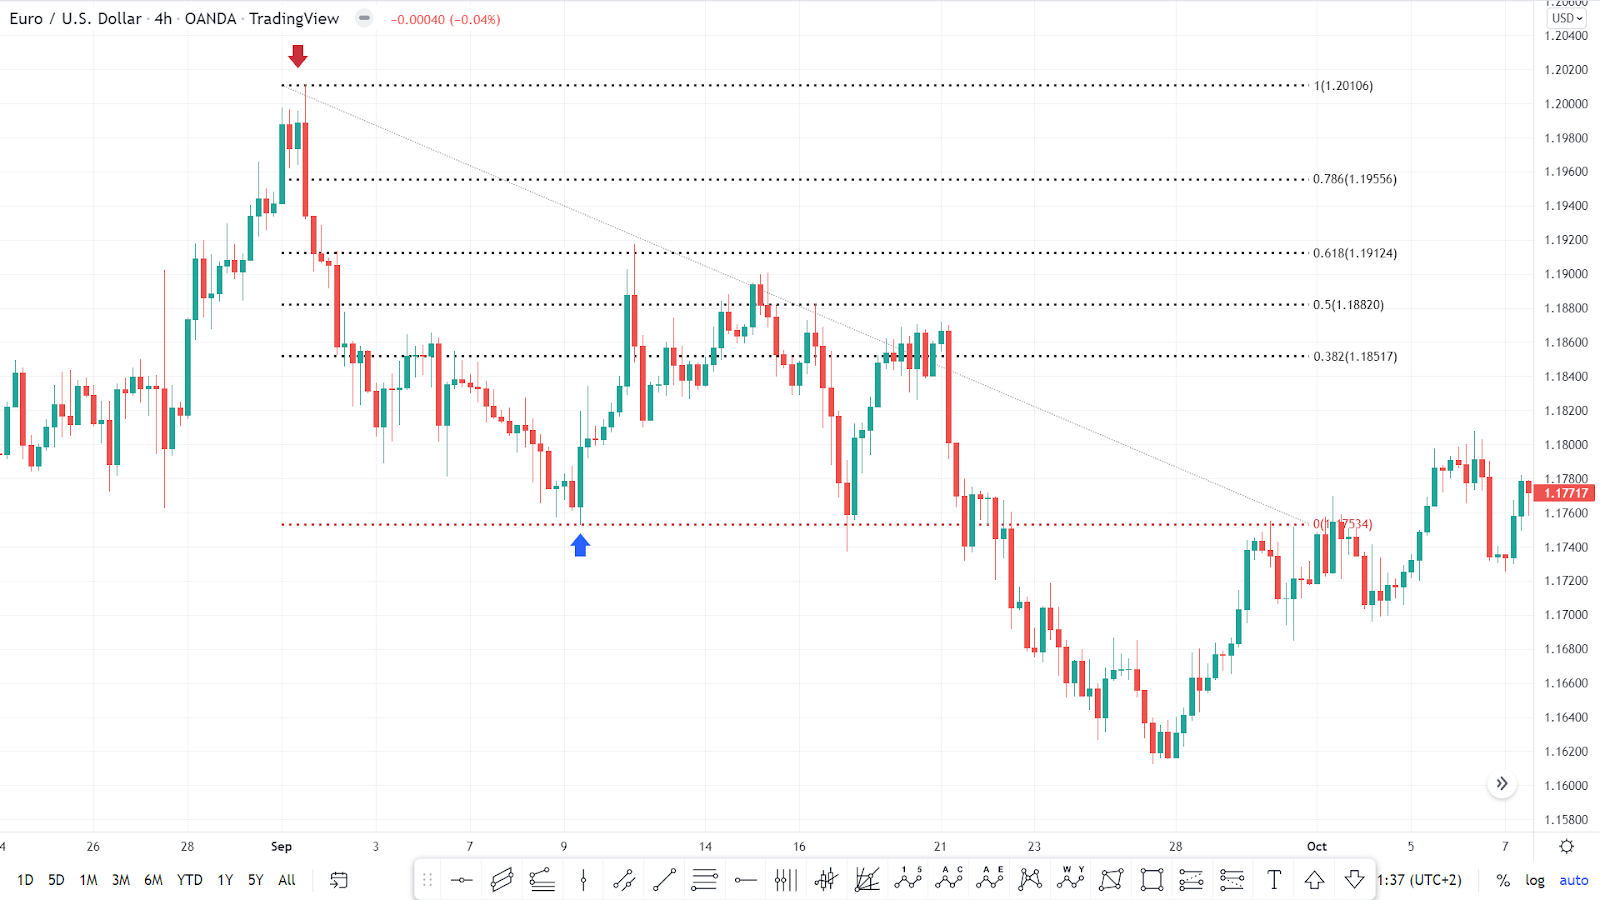
Traders use Fibonacci retracement levels to forecast when price corrections will end and start an uptrend (Figure 2), or when sellers will enter the market and start a downtrend (Figure 3).
Figure 2
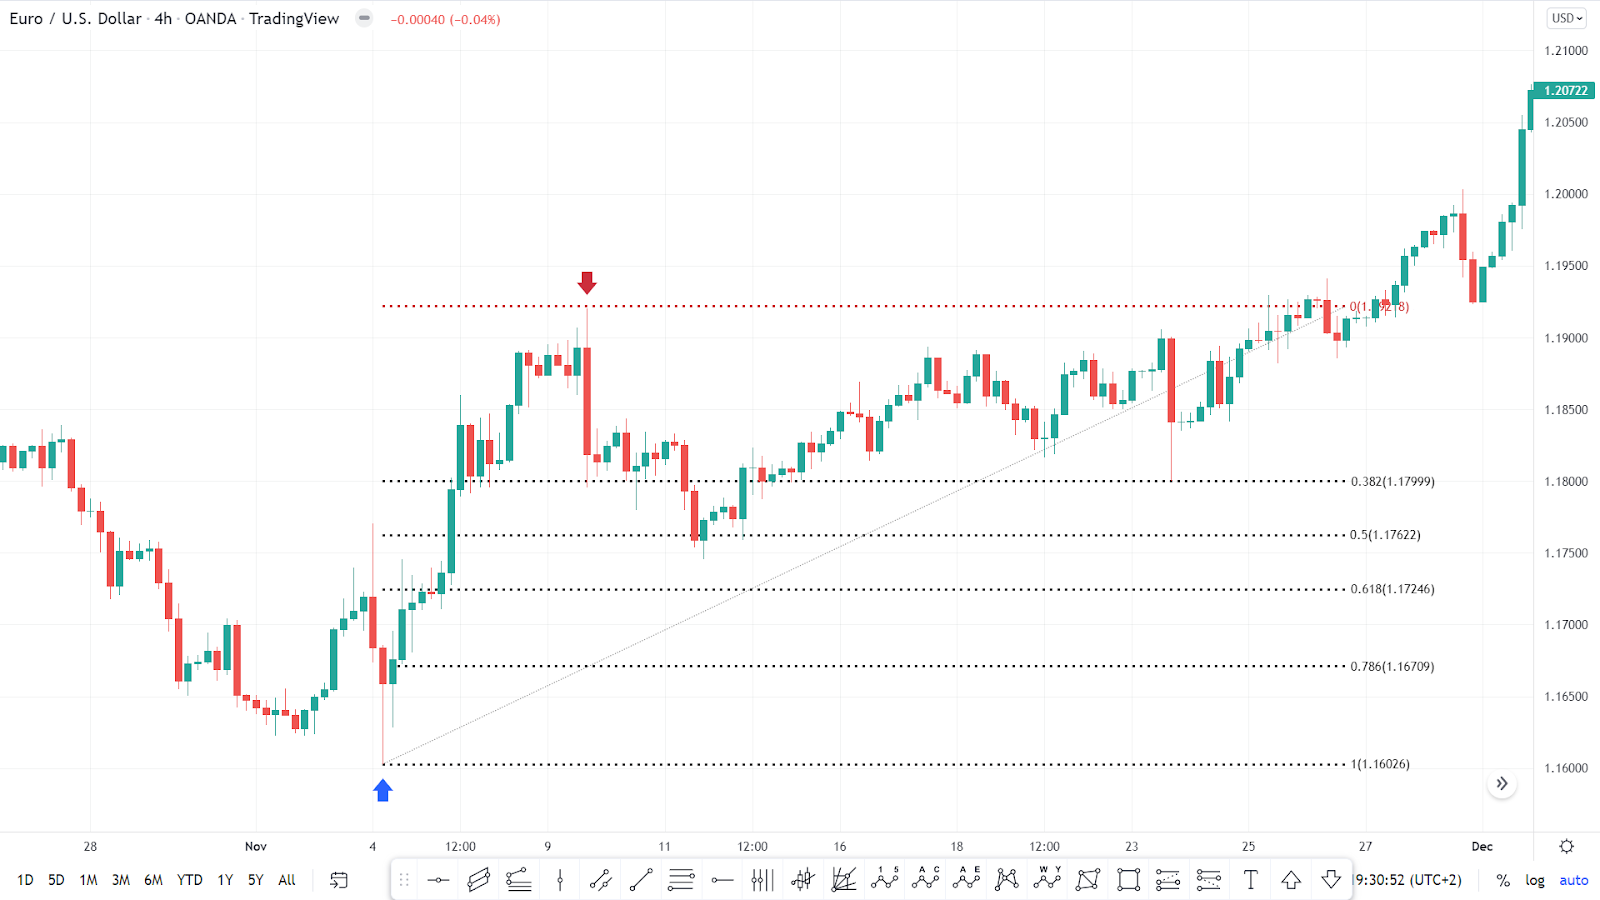
Figure 3
How do you draw Fibonacci retracement levels?
In the uptrend, we draw retracement from major trough to major peak, as shown in Figure 4, and in the downtrend, we draw from major peak to major trough, as shown in Figure 5.
Figure 4
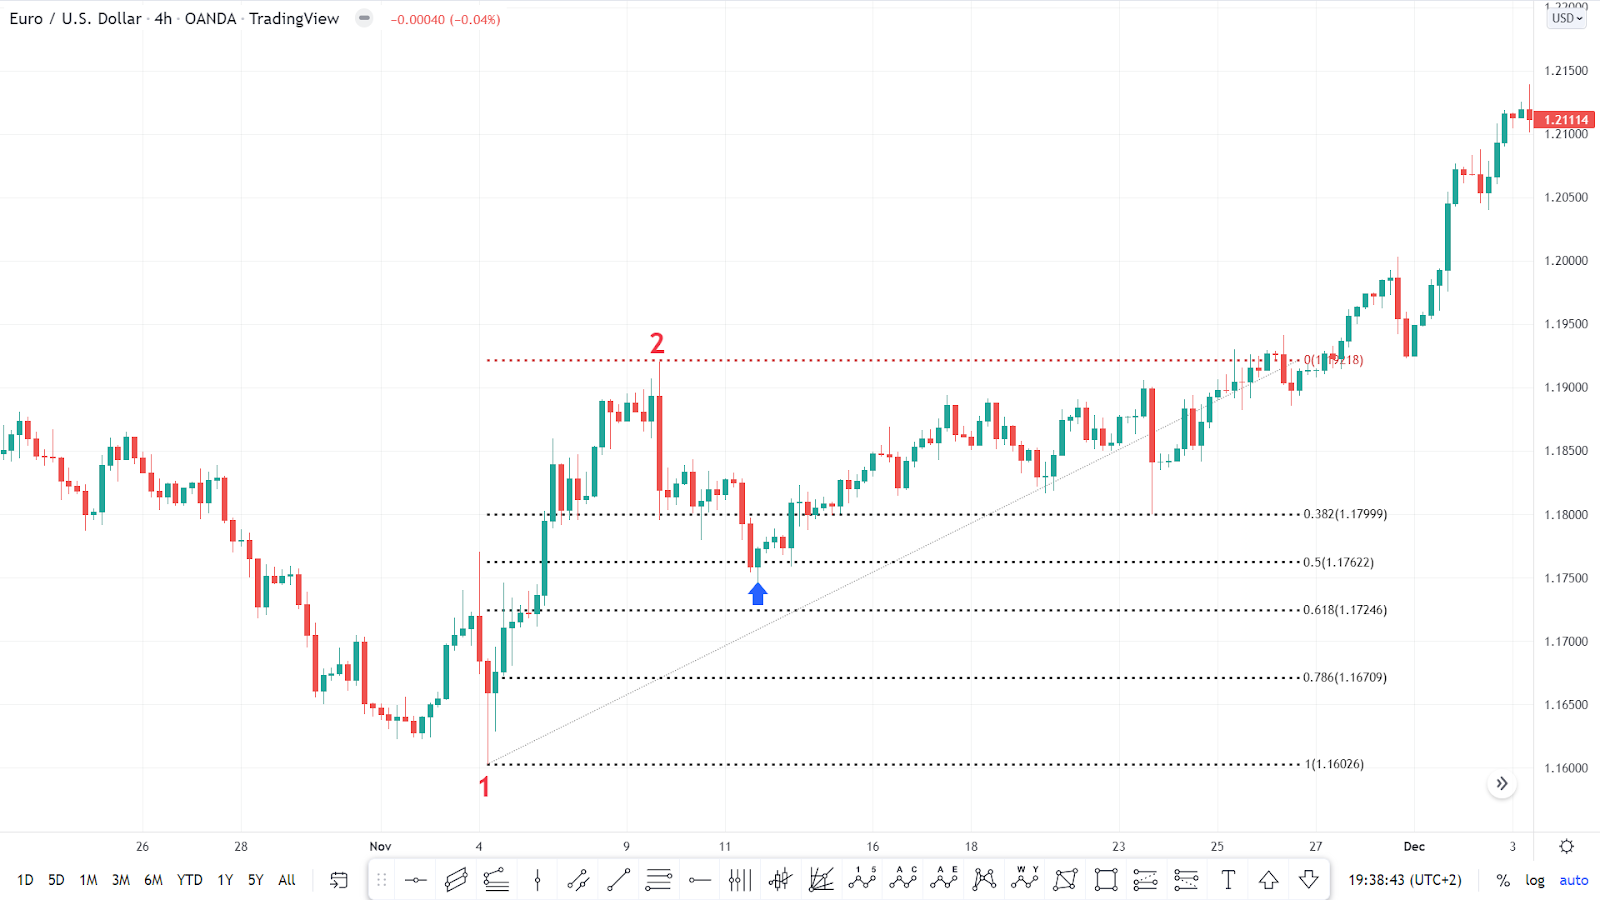
Figure 5
How to use the Fibonacci retracement in trading
Fibonacci retracement lines are often used as part of trend-trading strategies. If a retracement is taking place within a trend, you could use the Fibonacci levels to place a trade in the direction of the underlying trend.
The idea is that there is a higher chance a security’s price will bounce from the Fibonacci level back in the direction of the initial trend. By plotting Fibonacci ratios such as 61.8%, 38.2%, and 23.6% on a chart, traders may identify possible retracement levels and enter potential trading positions.
Using the Fibonacci retracement in an uptrend
During an uptrend, buyers have total control over prices, and prices make higher highs and higher lows. When prices form a higher high, some traders begin to take some profit from their winning positions, forcing prices to decline and move downward.
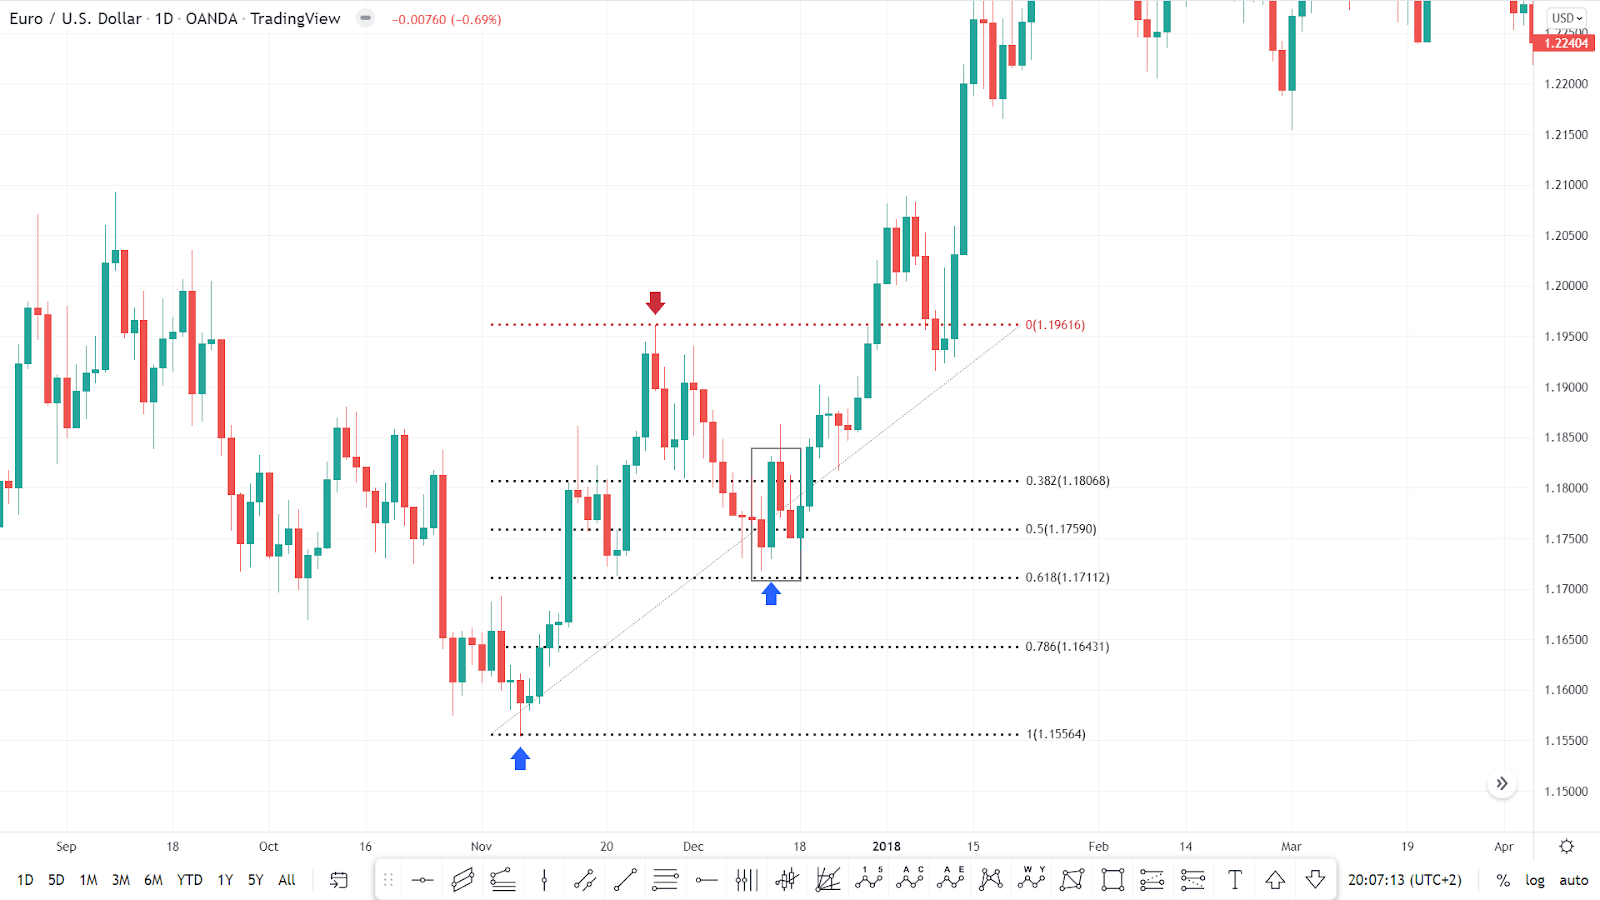
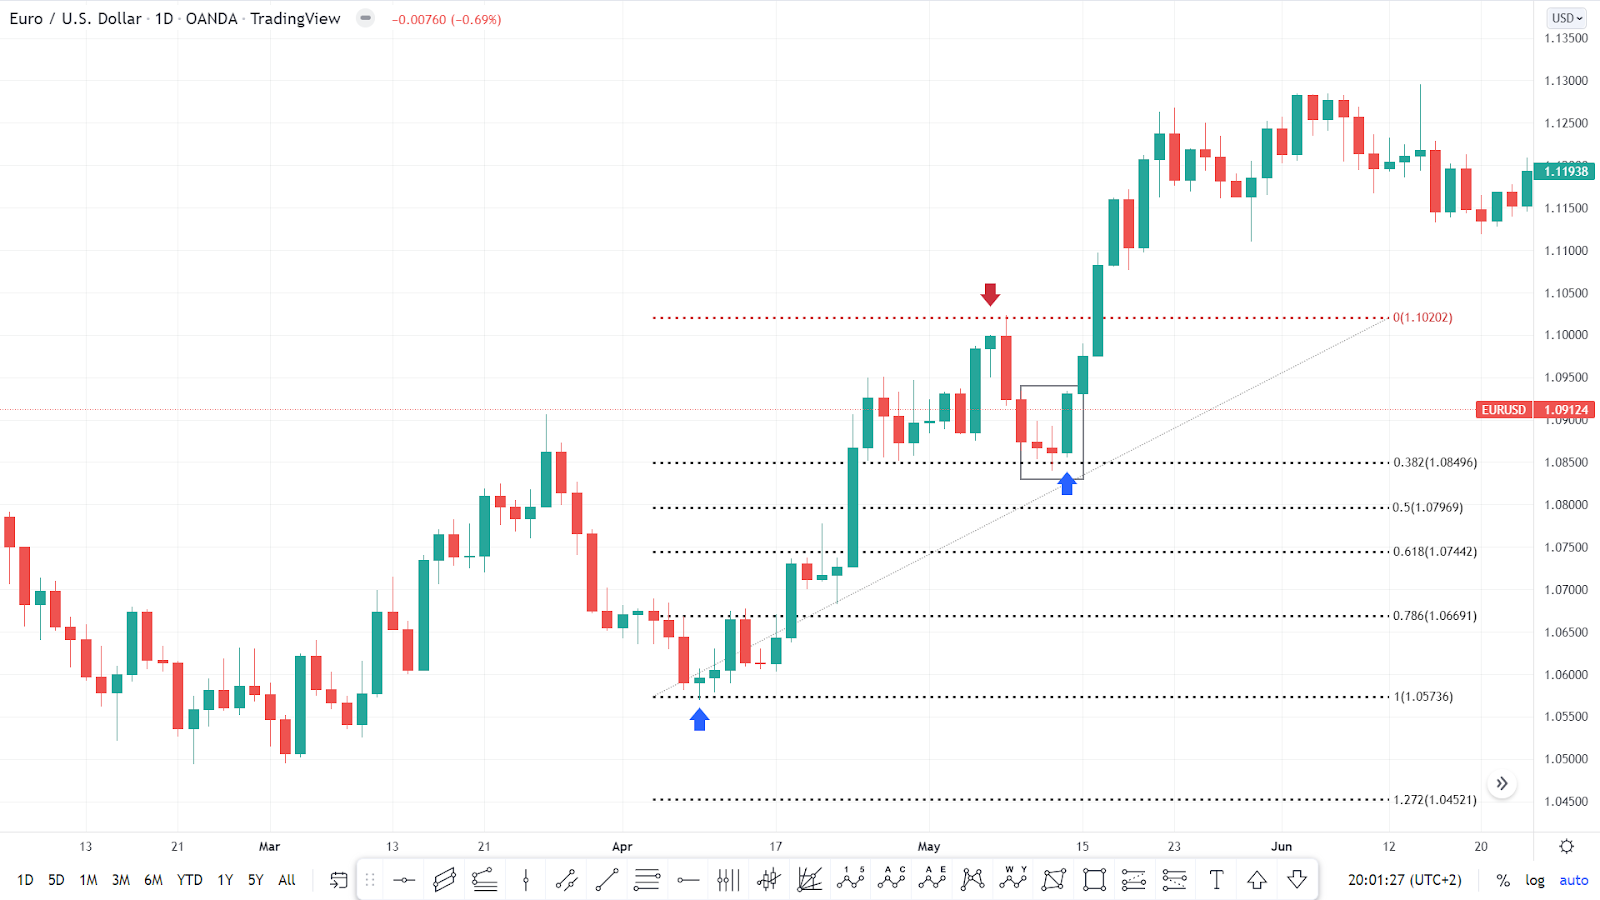
This movement is called a correction. The trader will wait for any reversal candlestick pattern around any Fibonacci retracement levels to buy again during the uptrend, as shown in Figure 6 and Figure 7.
Figure 6
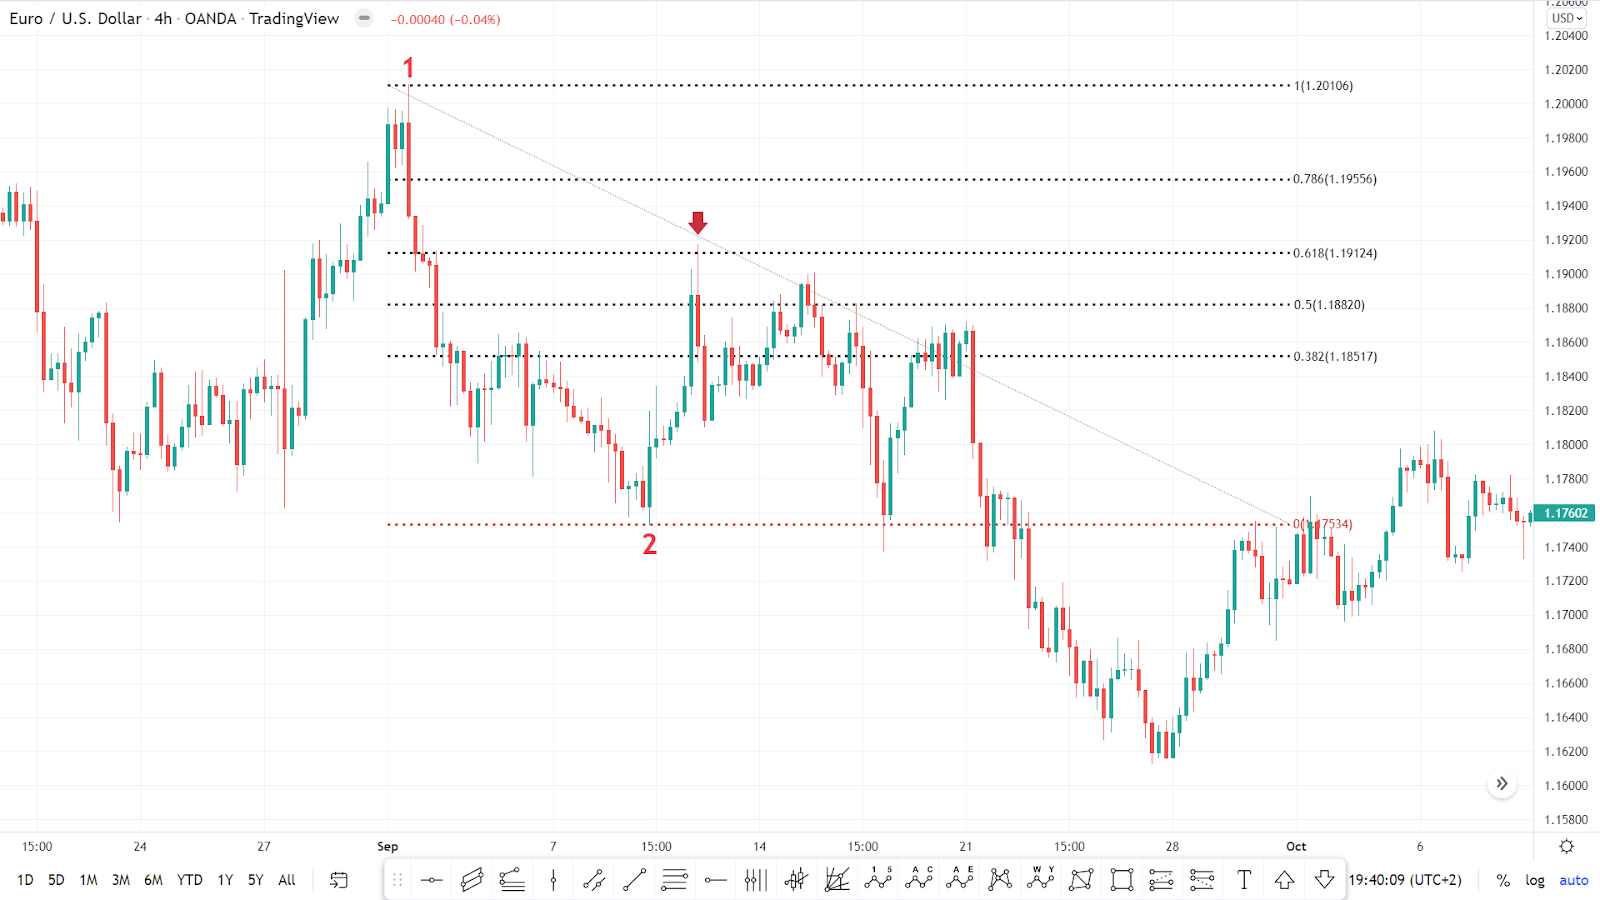
Figure 7
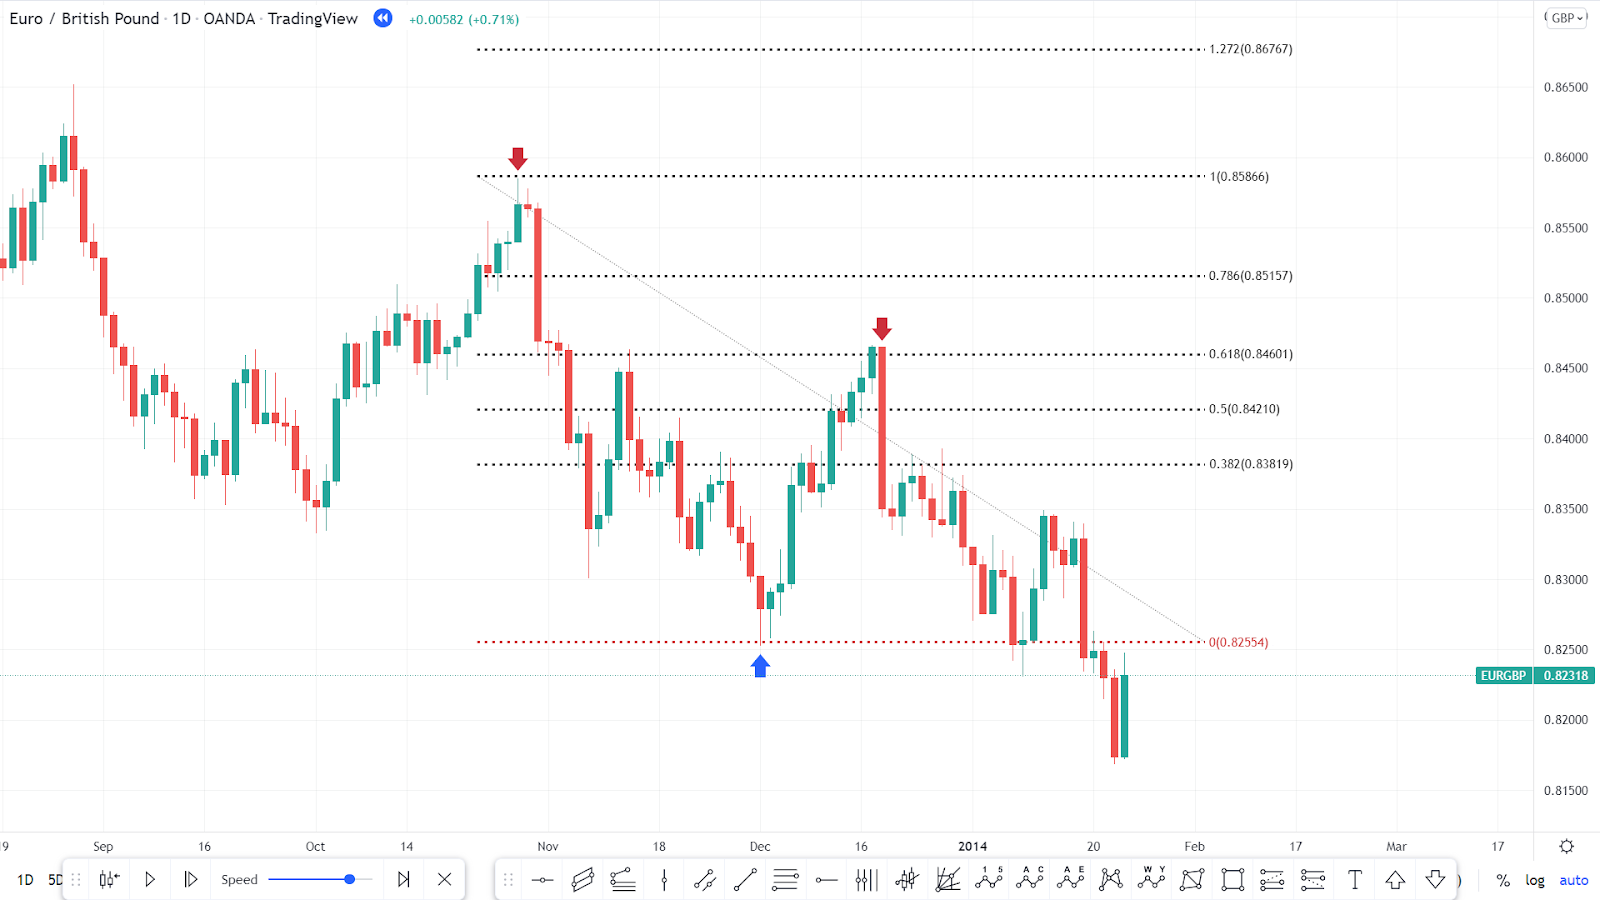
Using the Fibonacci retracement in a downtrend
During downtrends, sellers have total control over prices, and prices make lower highs and lower lows. When prices form a lower low, some traders begin to take some profit on their positions, forcing prices to rise and move upward.
This movement is called an upward correction. The trader will wait for any reversal candlestick pattern around any Fibonacci retracement levels to sell again during the current downtrend, as shown in Figure 8 and Figure 9.
Figure 8
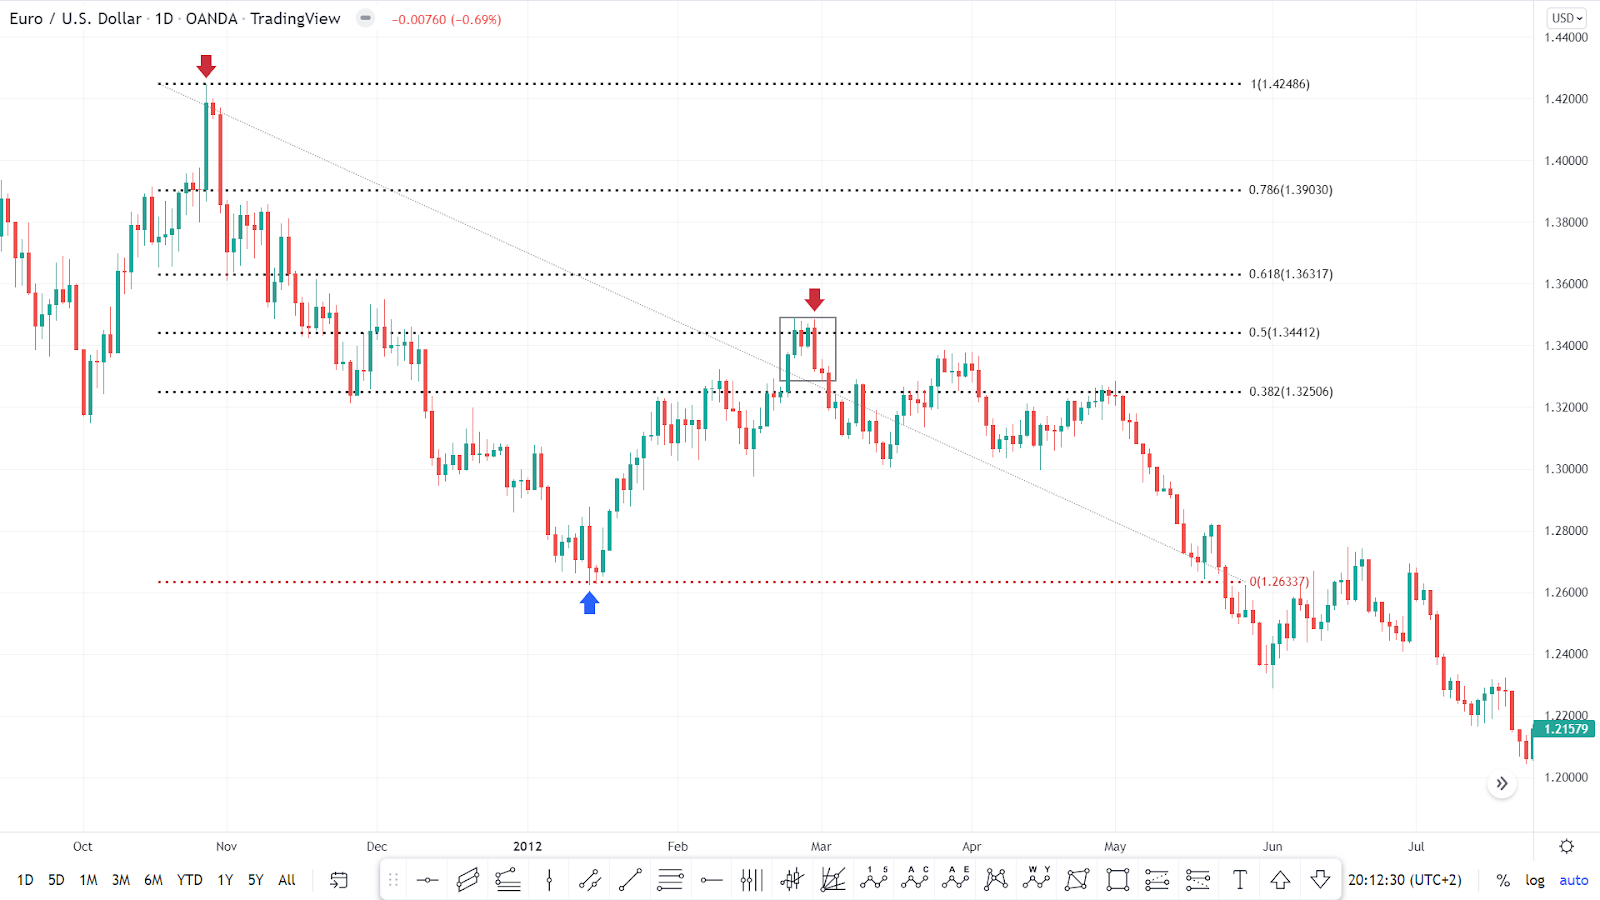
Figure 9
Limitations of Using Fibonacci Retracement Levels
While the retracement levels indicate where the price might find support or resistance, there are no assurances the price will stop there. This is why other confirmation signals are often used, such as the price starting to bounce off the level.
Another argument against relying heavily on Fibonacci retracement levels is that there are so many of them that the price is likely to reverse near one of them often. The problem being that traders struggle to know which one will be useful at any time. When it doesn't work out, it can always be claimed that the trader should have been looking at another Fibonacci retracement level instead.
Conclusion
Fibonacci retracements are useful tools that help traders identify support and resistance levels, but traders must use other technical tools with them to ensure they’re making the best trading decision.
Disclaimer: The content published above has been prepared by CFI for informational purposes only and should not be considered as investment advice. Any view expressed does not constitute a personal recommendation or solicitation to buy or sell. The information provided does not have regard to the specific investment objectives, financial situation, and needs of any specific person who may receive it, and is not held out as independent investment research and may have been acted upon by persons connected with CFI. Market data is derived from independent sources believed to be reliable, however, CFI makes no guarantee of its accuracy or completeness, and accepts no responsibility for any consequence of its use by recipients.


