
- Investing
 SpecialsAccountsTrading DetailsCFI AIHelp & SupportPartnership
How to trade using moving average convergence divergence (MACD)

Introduction
The moving average convergence-divergence (MACD) timing model has become one of the most popular technical tools, used by short- and long-term investors in the stock, bond, and other investment markets. It is a featured indicator on virtually every computer-based technical trading program and trading platform.
MACD can be used in the analysis of longer-term trends. It can be applied to somewhat shorter time periods, reflected by weekly or daily data, in the analysis of intermediate- and shorter-term market trends.
It can also be applied on an intraday basis for time frames as short as hours or minutes, which makes it suitable for short-term day-trading purposes. The indicator is frequently capable of producing precise entry and exit signals—one of its strongest features is its ability to detect the conclusions of favorable market entries following serious intermediate market declines.
MACD components
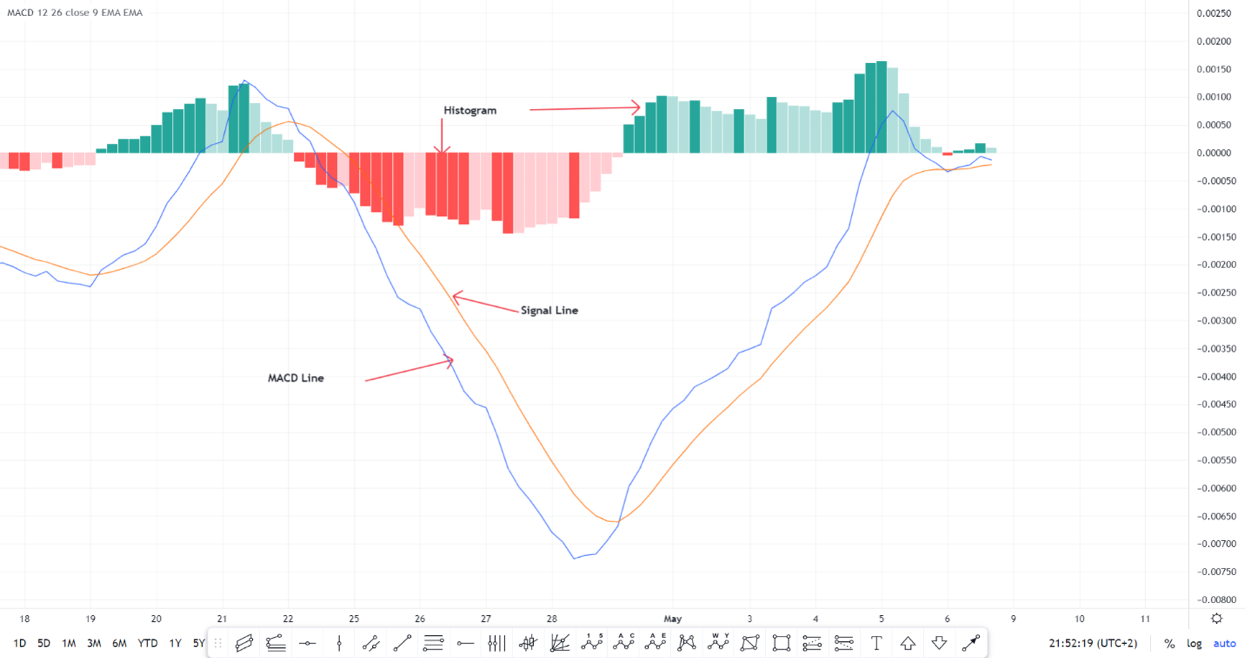
The MACD indicator is composed of three parts (as shown in Figure 1):
- MACD line: The difference between the fast-moving average and the slow-moving average. MACD line = 12-Period EMA - 26-Period EMA.
- Signal line: Moving average of the MACD line to signal changes in the price momentum. Signal line = 9-day EMA of MACD line.
- Histogram: Shows the difference between the MACD line and the signal line. MACD histogram = MACD line - signal line.
Figure 1
What moving averages should be used for MACD?
There are no hard and fast rules. As a general rule, the longer-term moving average will be two to three times the length of the shorter-term average. The shorter the shorter-term average is, the more sensitive the MACD will be to short-term market fluctuations. The 12-26 combination shown in Figure 1 is widely employed but is hardly the only possibility.
How to interpret the MACD indicator?
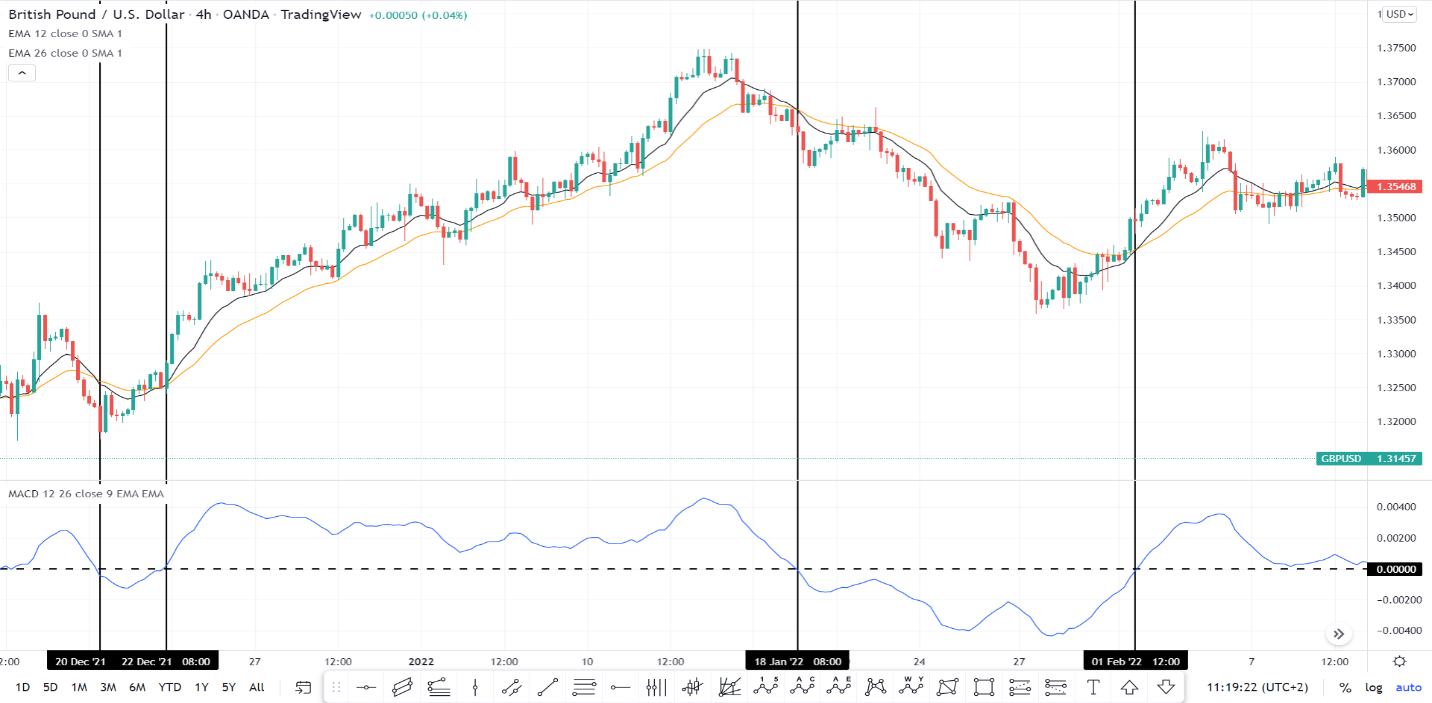
MACD line and the zero level
The line is the difference between the fast-moving average and the slow-moving average, so when the MACD line moves above the zero line that means the faster-moving average (12 EMA) crosses above the slower-moving average (26 EMA), indicating bulls gaining momentum over sellers. When the MACD line moves above the zero line it is a bullish signal and when the line moves below the zero line it is a bearish signal, shown in Figures 2, 3, and 4.
Figure 2
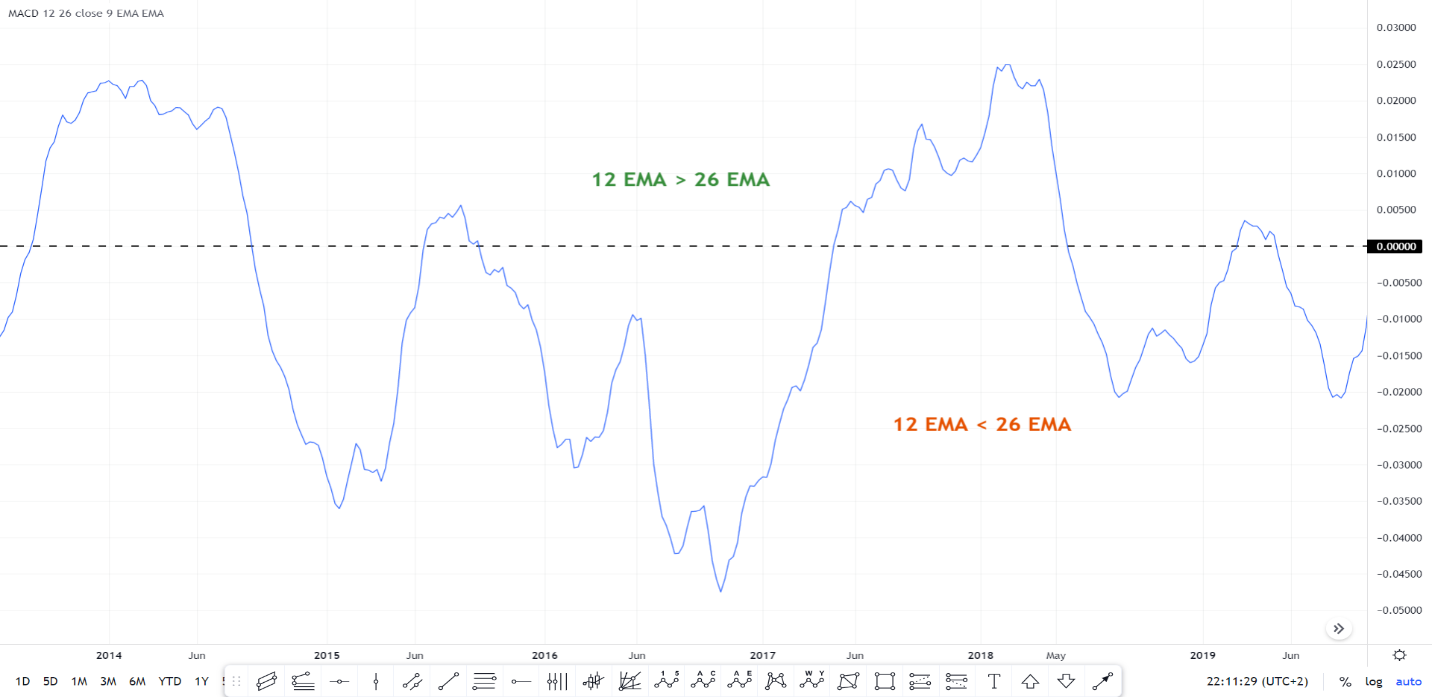
Figure 3
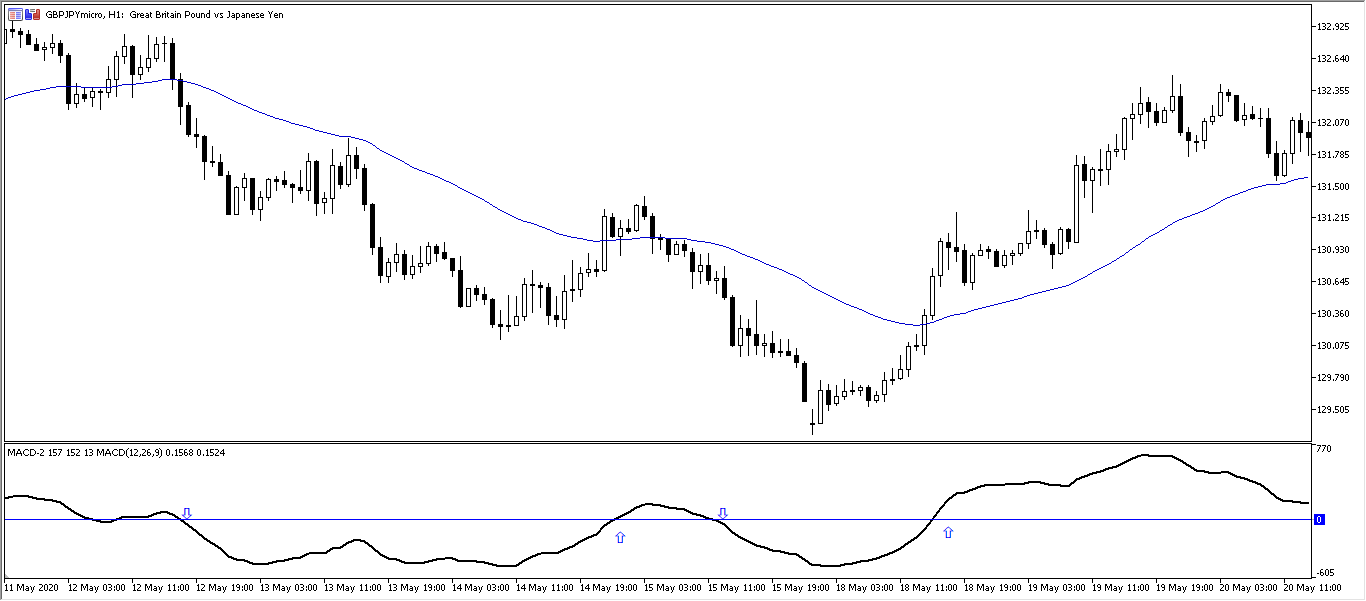
Figure 4
MACD line and signal line crossover
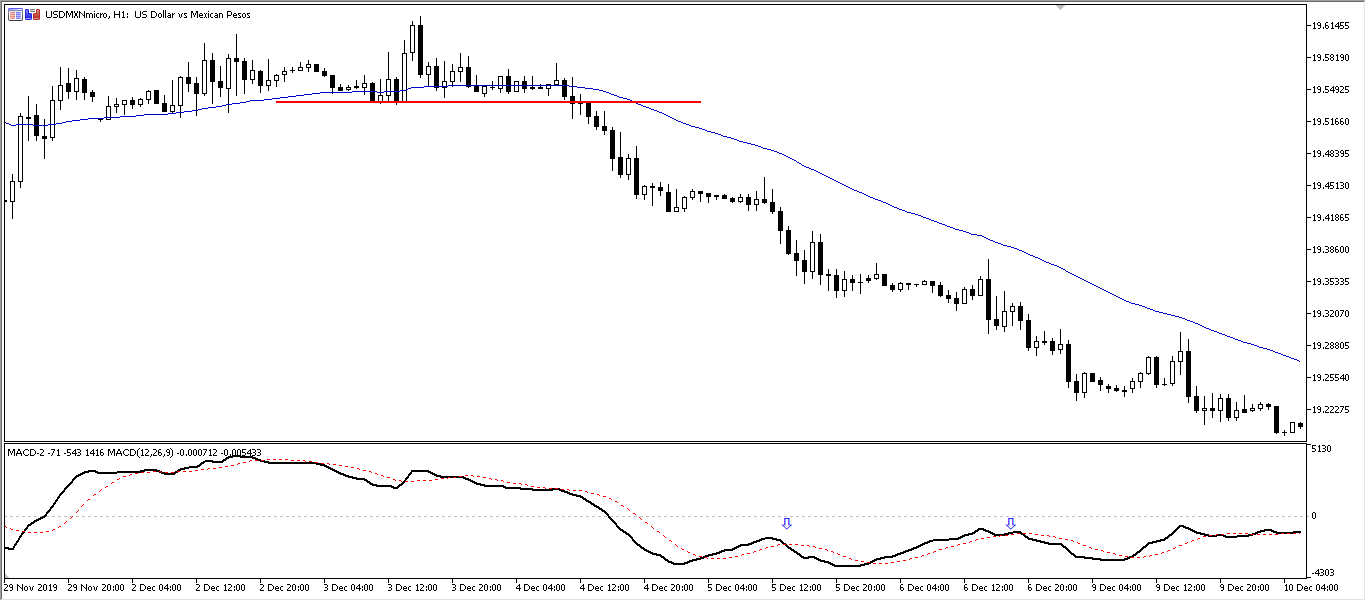
When the MACD line crosses above the signal line, then it is a bullish signal, When the MACD line crosses below the signal line, then a bearish signal is determined. The bullish signal is more significant when it is above the zero line, and the bearish signal is more significant when it occurs below the zero line, as shown in Figures 5, 6, 7, and 8.
Figure 5
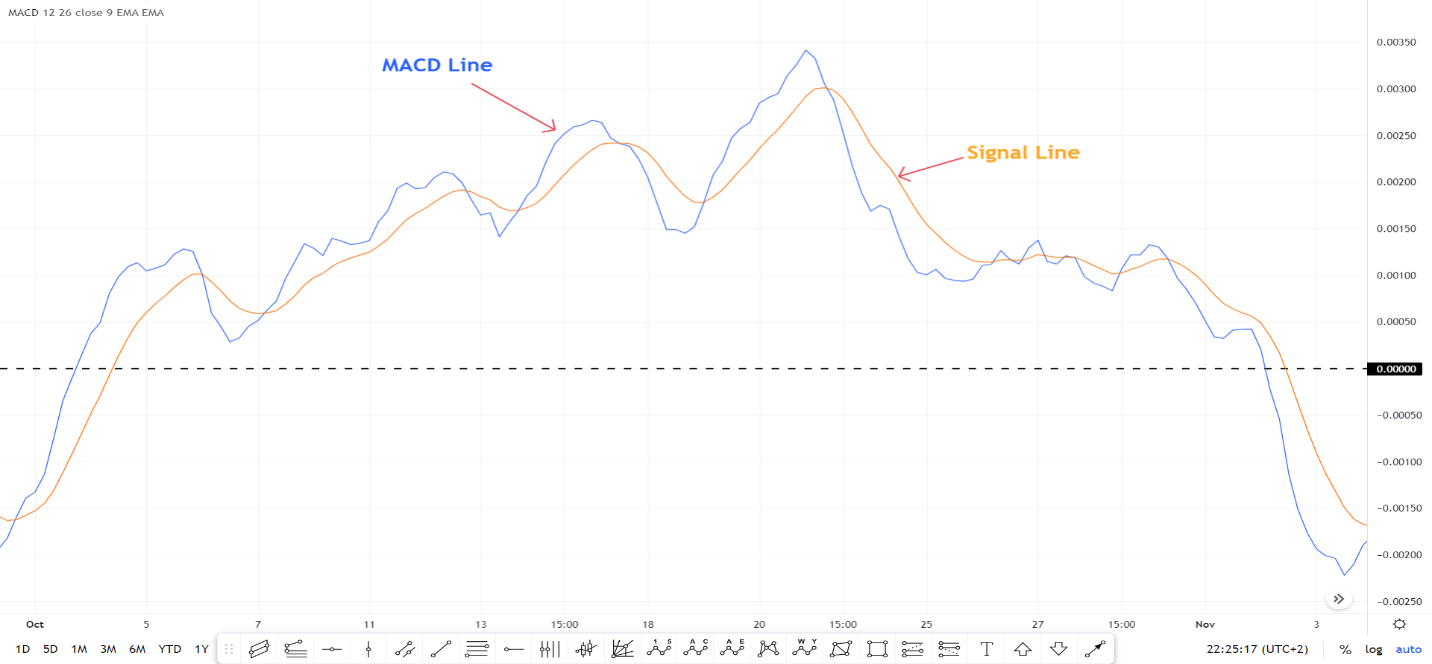
Figure 6
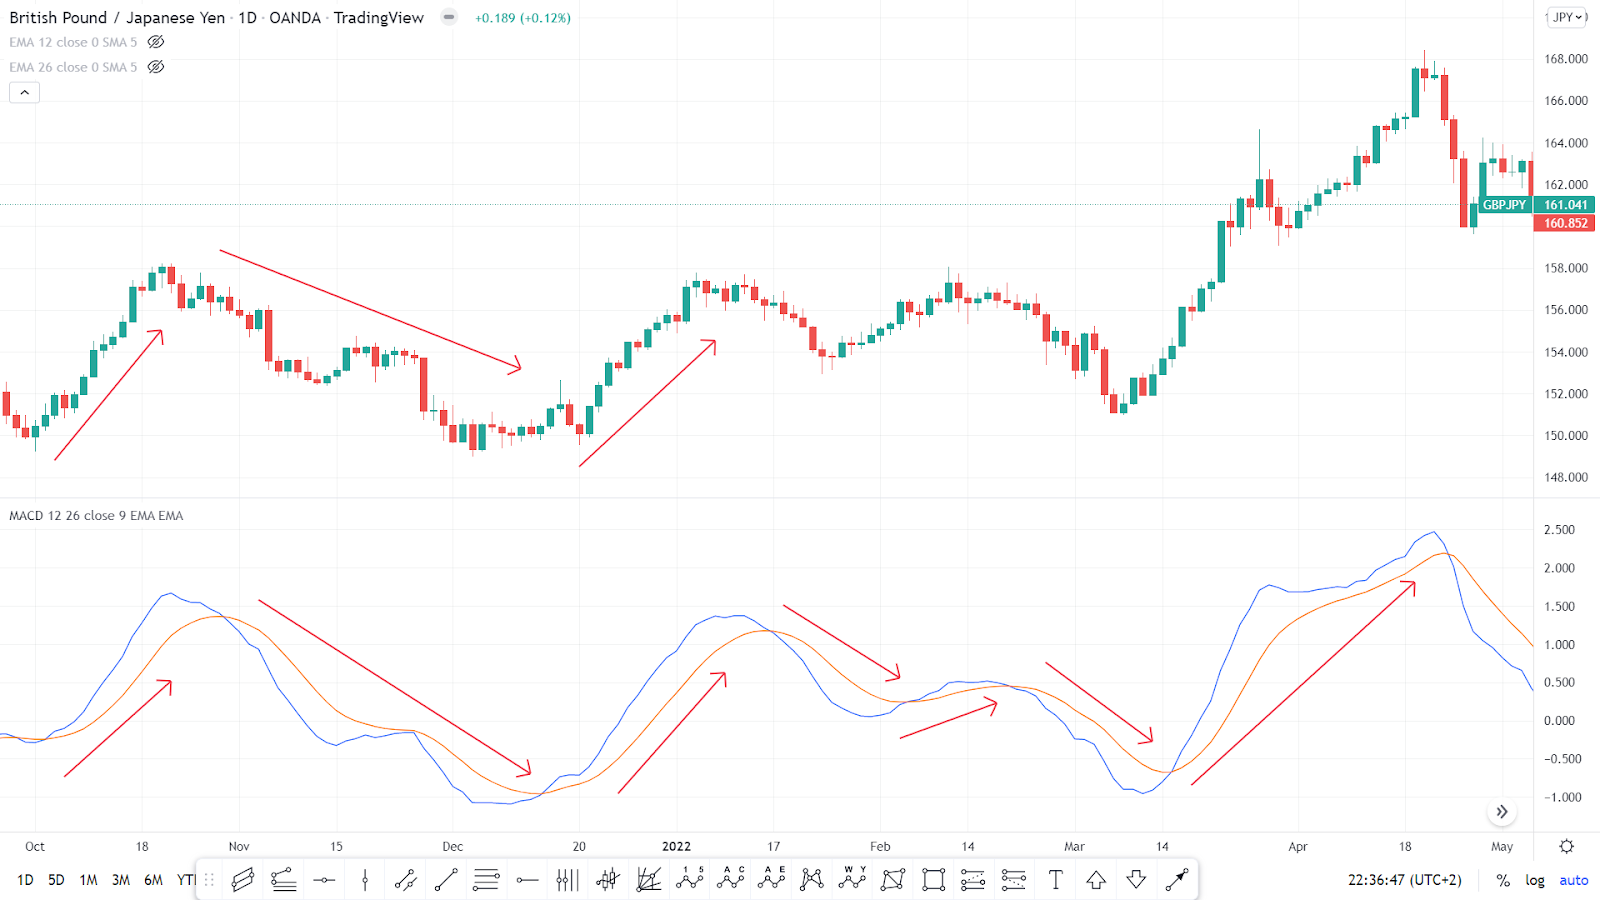
Figure 7
Figure 8
MACD signals are more likely to prove reliable if shorter-term MACD signals are confirmed by longer-term trends in the stock market, perhaps reflected by long-term MACD patterns. For example, purchases made based on daily MACD lines are more likely to succeed if weekly or monthly MACD patterns are favorable, indicating strength in the primary market cycle.
Short-term short sales are more likely to prove profitable if longer-term market trends are down. The maintenance of multiple MACD charts, reflecting the varying length of a market cycle, is recommended.
Histogram
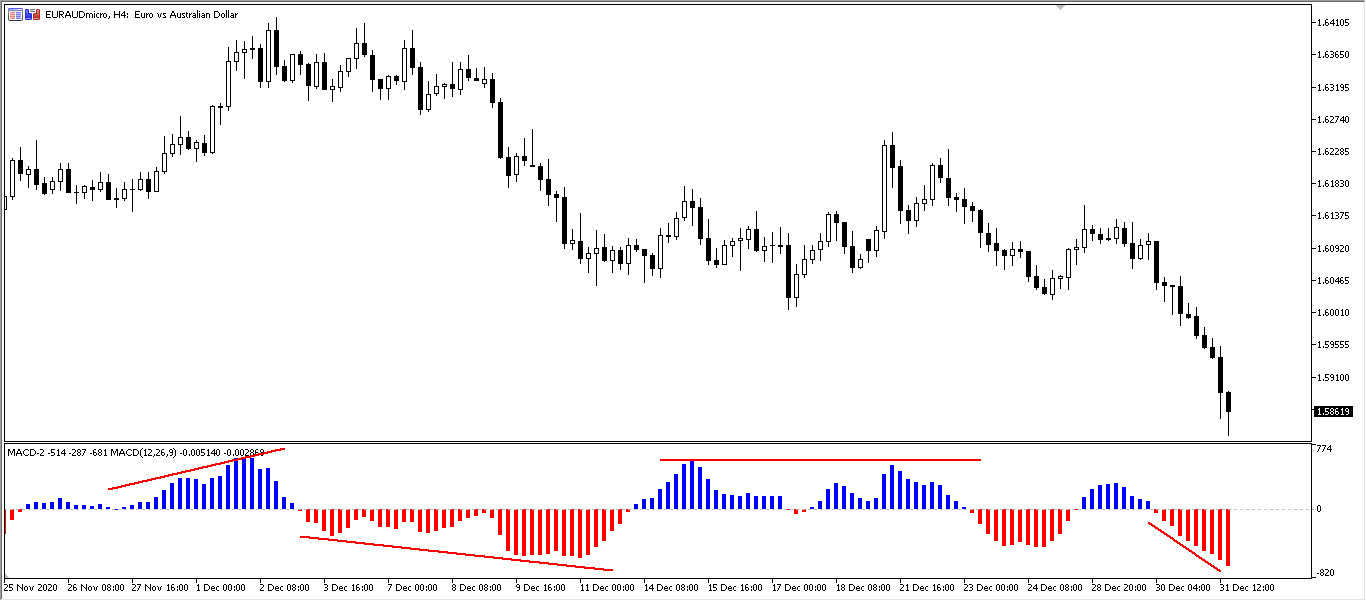
Histograms show the difference between the MACD line and the signal line. When the histogram moves above the zero line it means the MACD line crosses above the signal line. When it moves below the zero line, the MACD line moves below the signal line.
When the MACD line and signal line diverge, the histogram moves to higher values indicating strong momentum. Traders should compare the histogram peaks and bottom with prices to determine the health of the current trend, shown in Figure 9.
Figure 9
Divergence
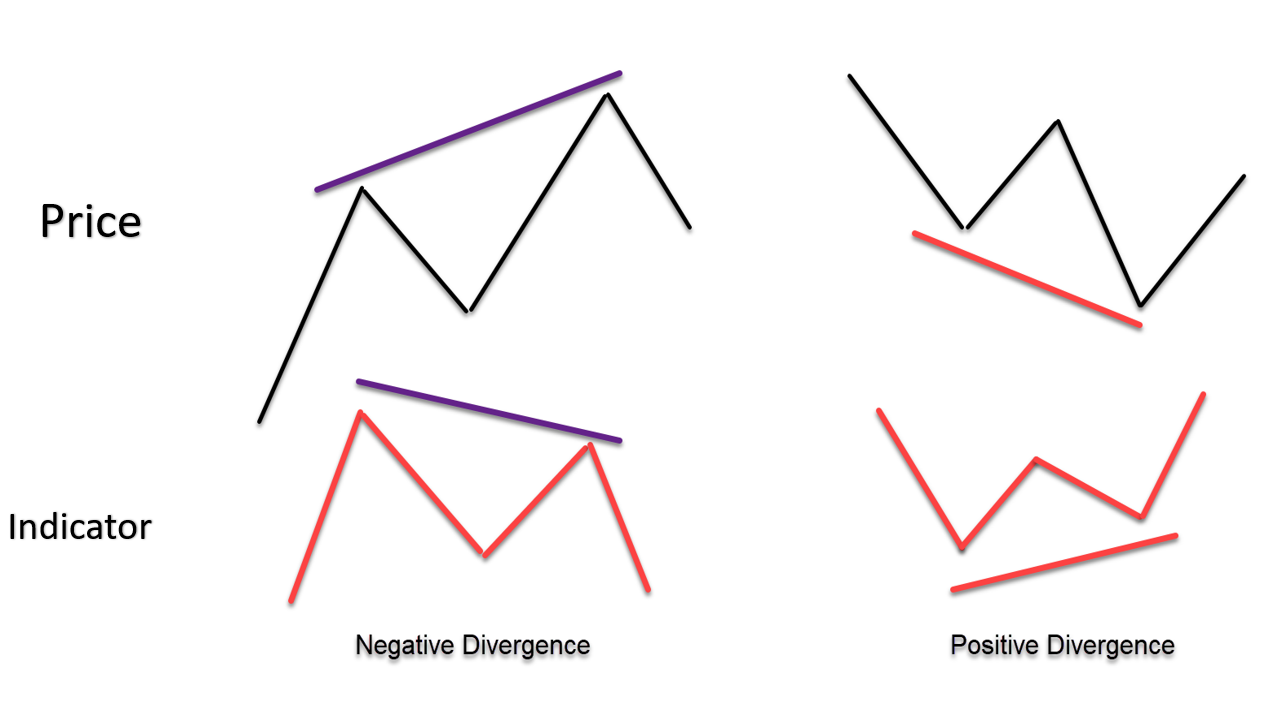
Divergence as a general term in trading can be defined as when an oscillator or momentum indicator does not confirm the direction of the current price movement. MACD divergence is the same. It’s when the price moves in one direction and the MACD moves in the opposite direction. There are two types, shown in Figure 10:
- Positive divergence occurs when the price makes a lower low, but the indicator makes a higher low, which means the current sellers are exhausted and a correction might occur.
- Negative divergence occurs when the price makes a higher high, but the indicator makes a lower high, meaning the current buyers are exhausted and a correction might occur.
Figure 10
The MACD indicator has two types of divergence
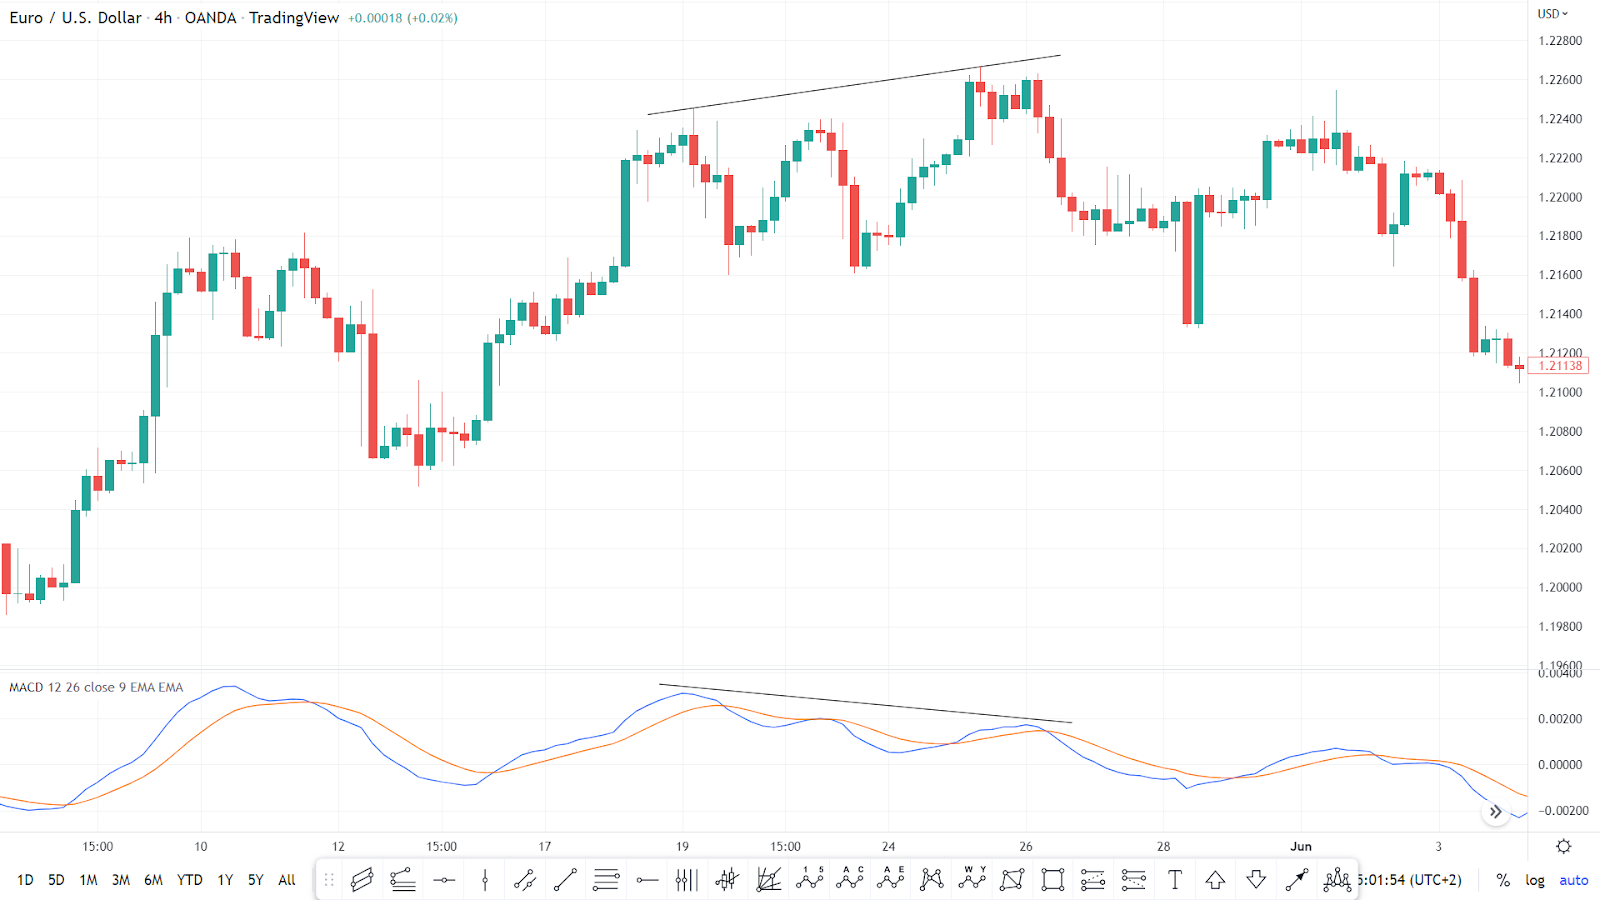
1. The divergence between the price and MACD line
When prices make a higher high, but the MACD line makes a lower high, this is called negative divergence, shown in Figure 11. When prices make a lower low, but the MACD line makes a higher low this is called positive divergence, shown in Figure 12.
Figure 11
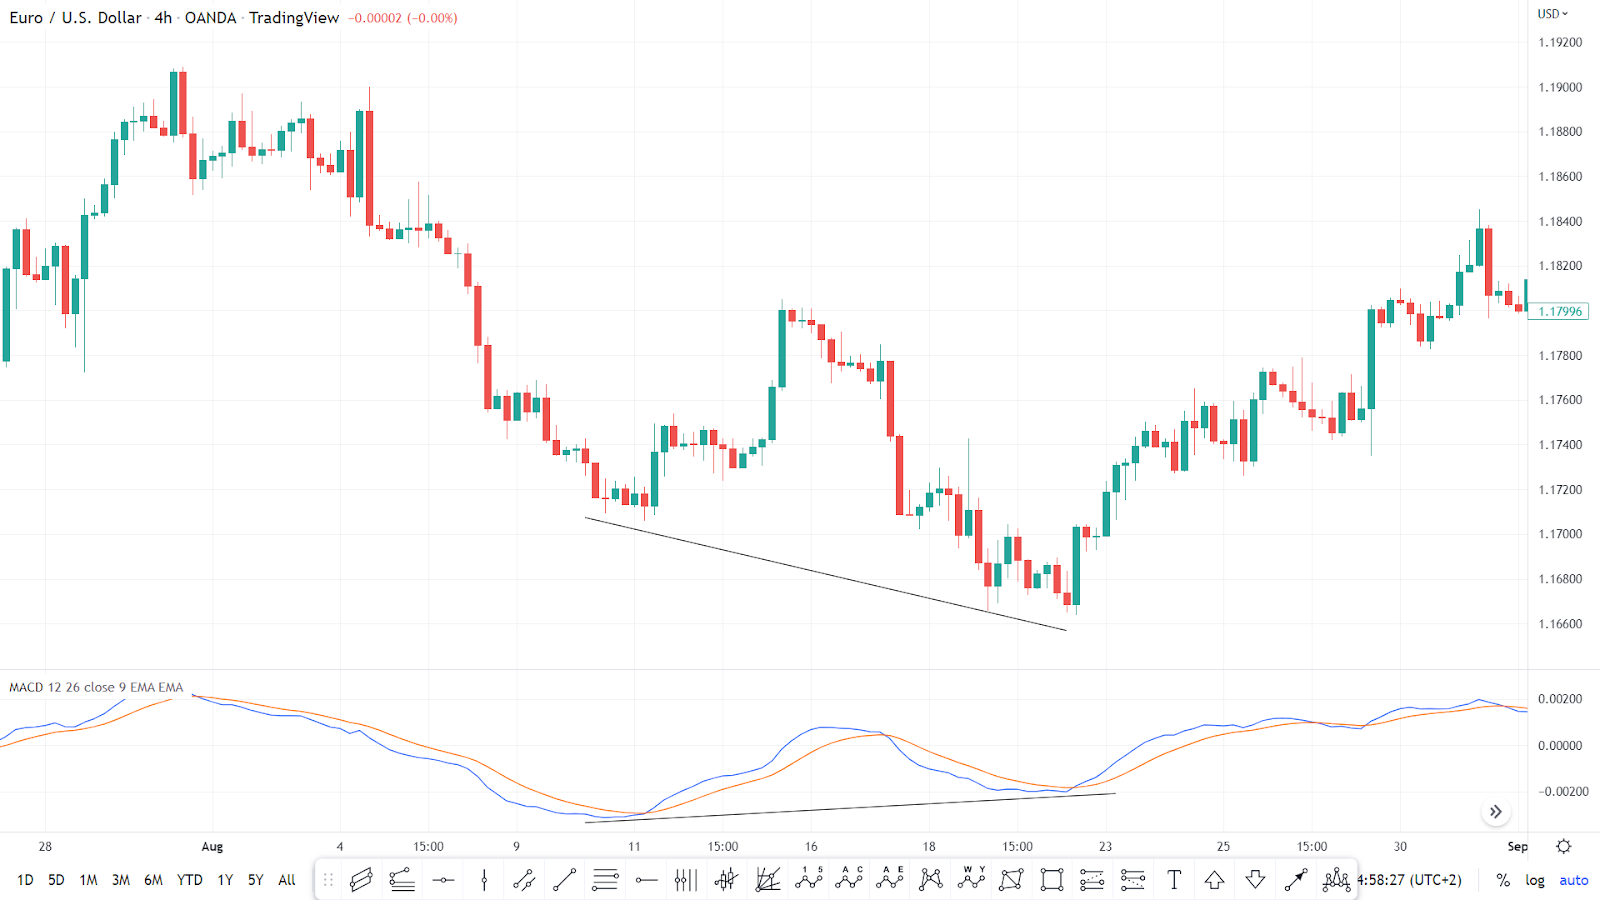
Figure 12
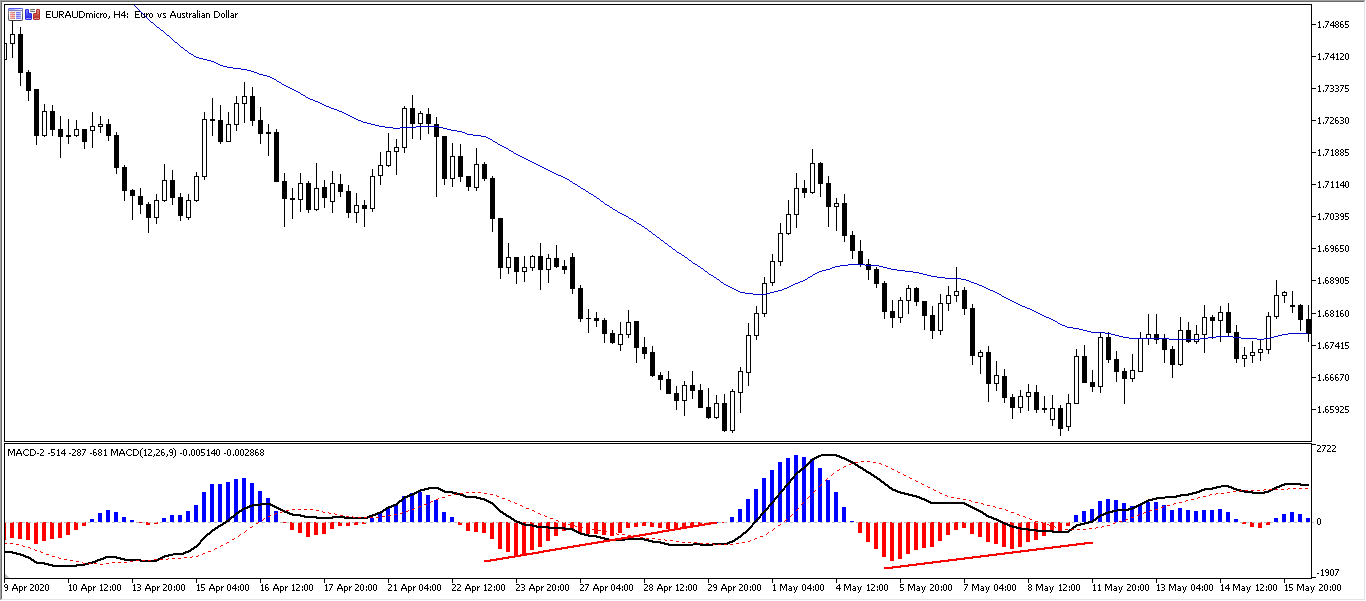
2. The divergence between the MACD line and histogram
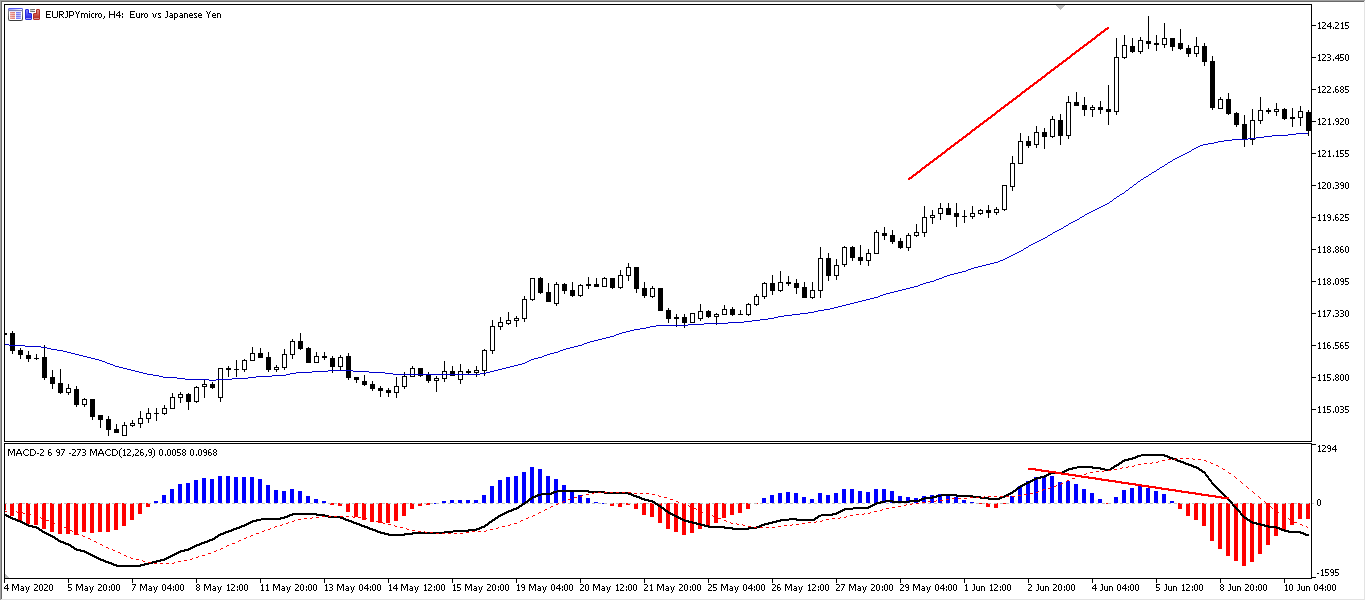
Bearish divergence: When the MACD line makes a higher high while the histogram makes a lower higher. This indicates a weakness in the current upward movement, shown in Figures 13, 14, and 15.
Figure 13
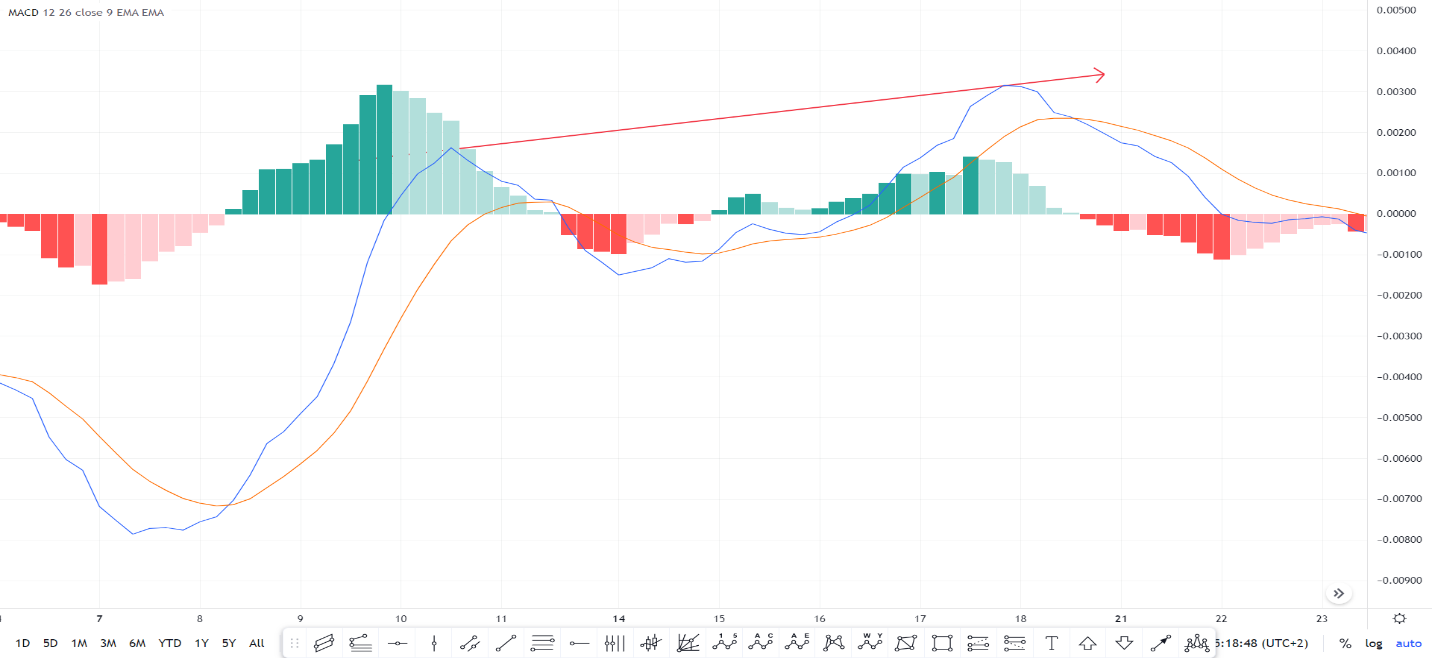
Figure 14
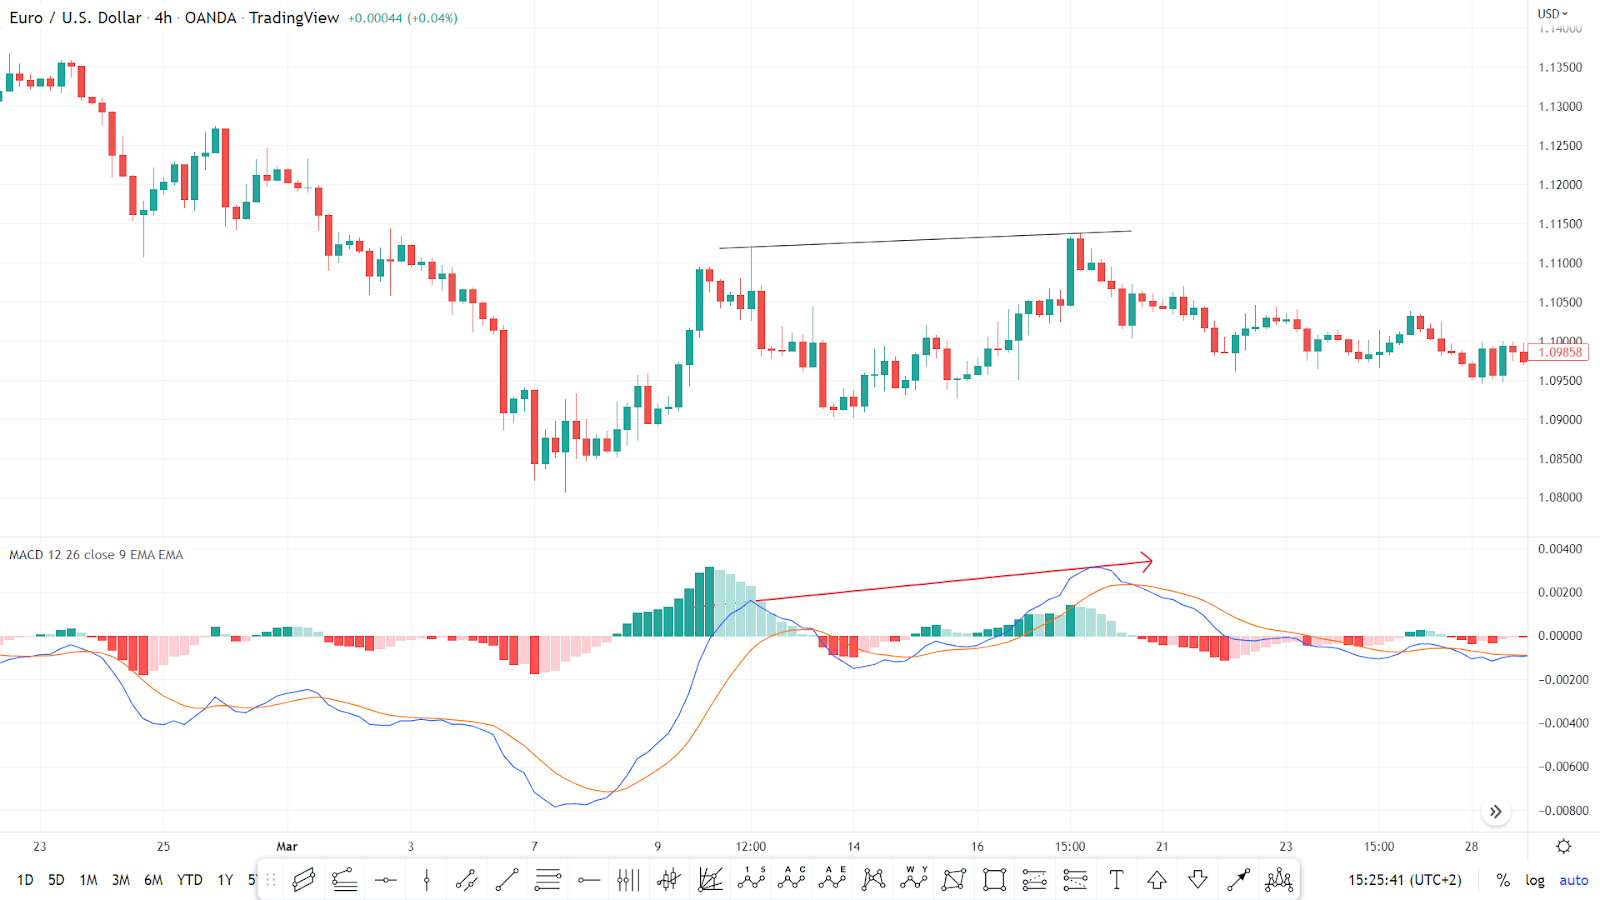
Figure 15
Bullish divergence: When the MACD line makes a lower low while the histogram makes a higher low. This indicates a weakness in the current downward movement, shown in Figures 16, 17, and 18.
Figure 16
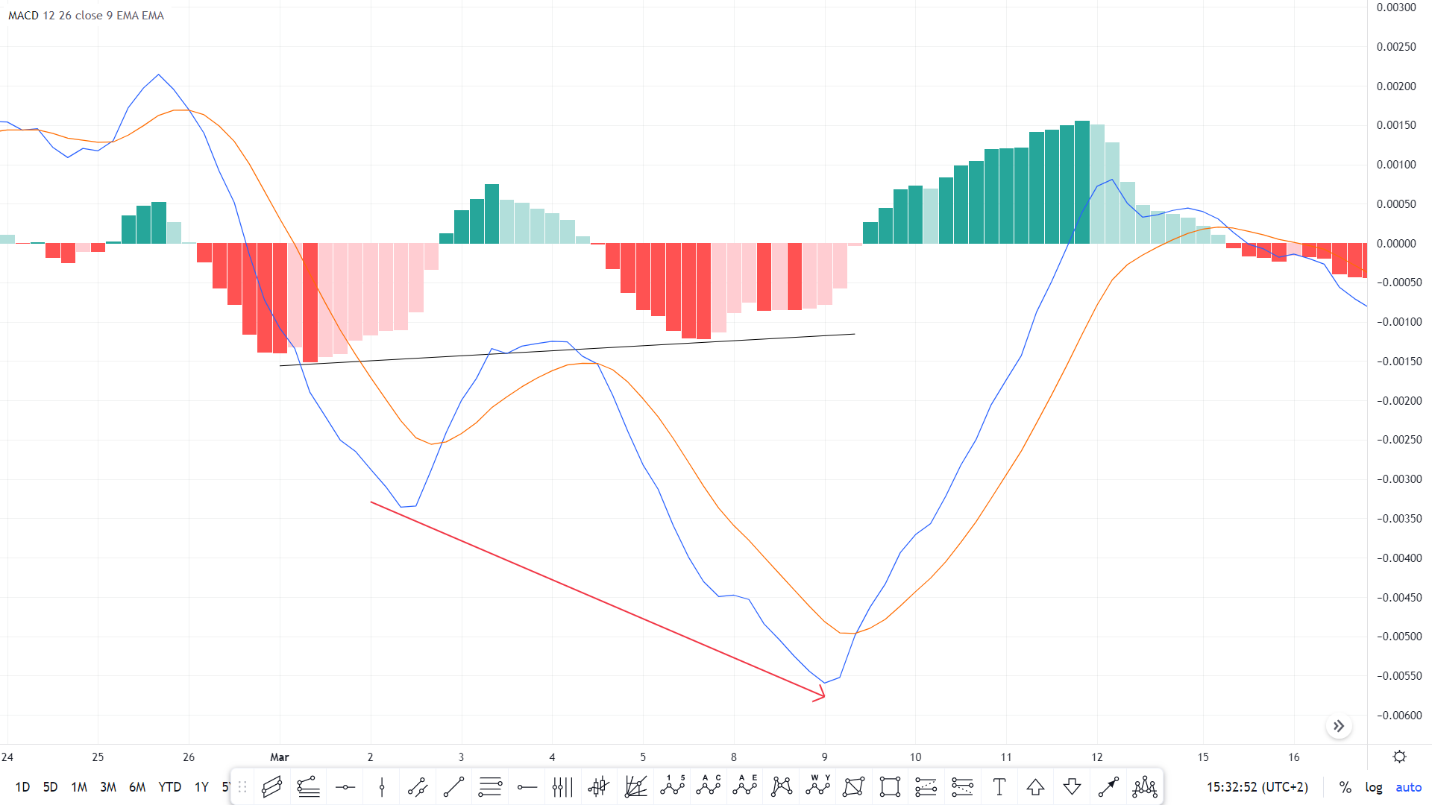
Figure 17
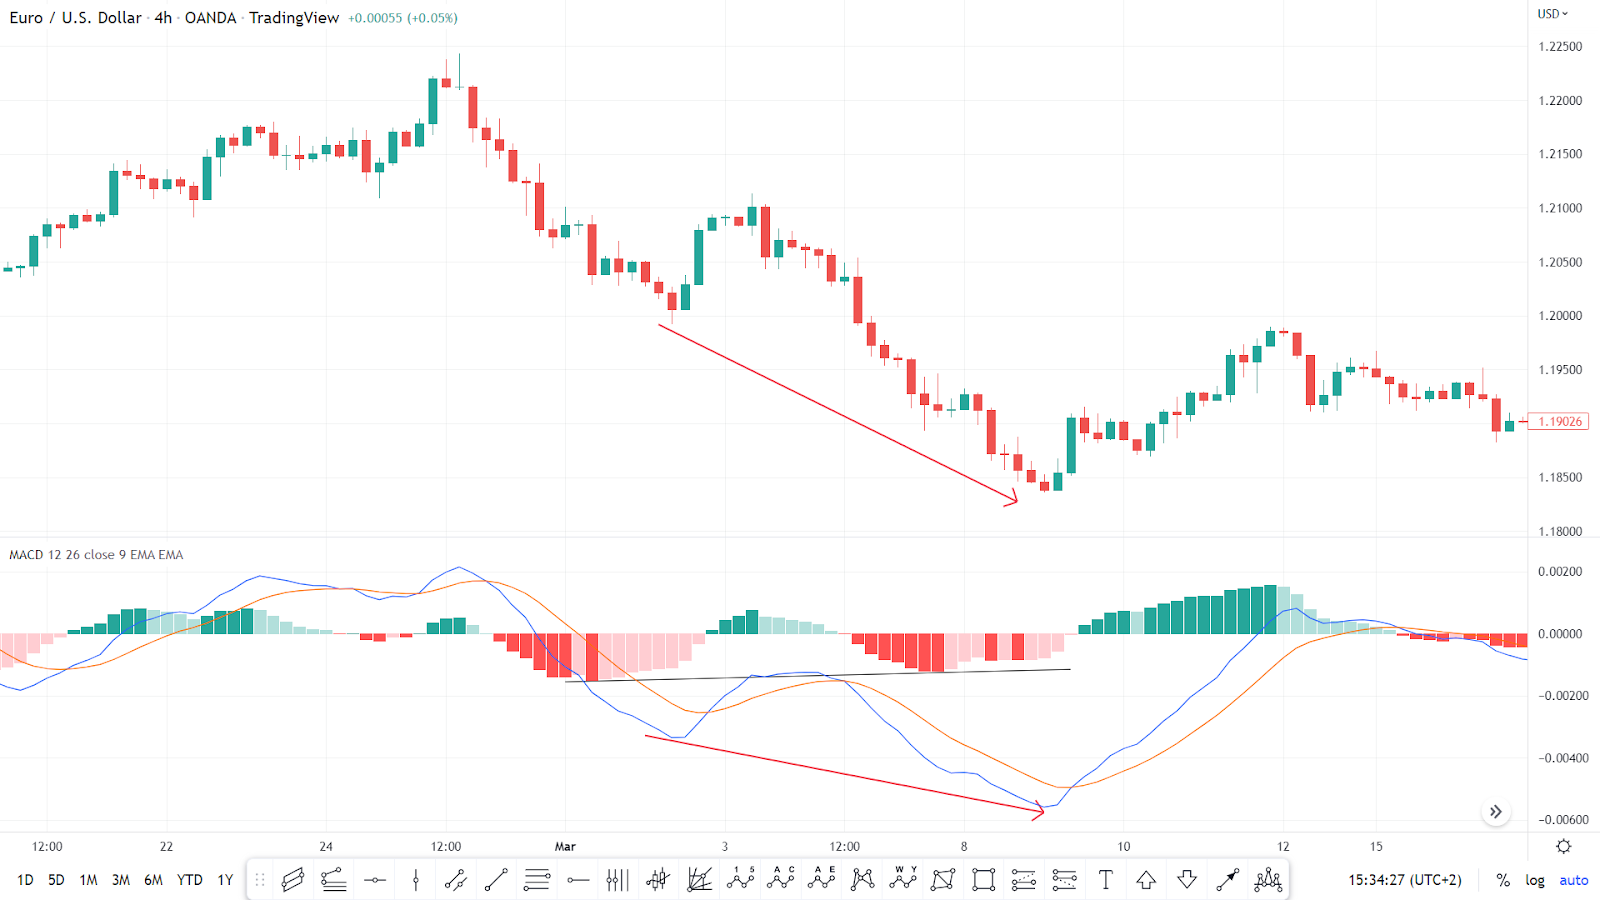
Figure 18
Disclaimer: The content published above has been prepared by CFI for informational purposes only and should not be considered as investment advice. Any view expressed does not constitute a personal recommendation or solicitation to buy or sell. The information provided does not have regard to the specific investment objectives, financial situation, and needs of any specific person who may receive it, and is not held out as independent investment research and may have been acted upon by persons connected with CFI. Market data is derived from independent sources believed to be reliable, however, CFI makes no guarantee of its accuracy or completeness, and accepts no responsibility for any consequence of its use by recipients.


